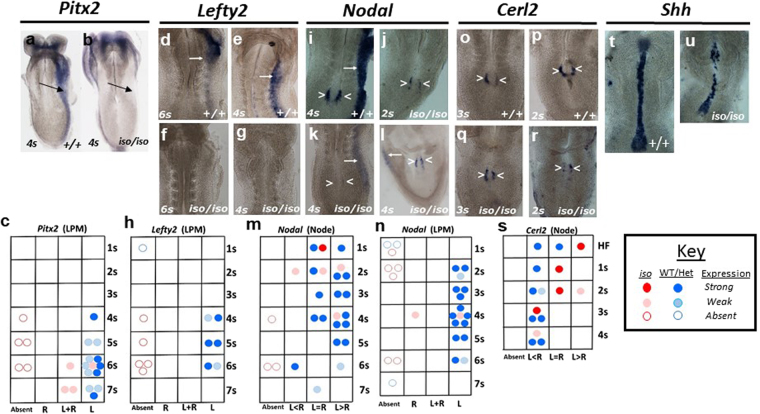
Figure 4.
Disrupted left-side specification in the Zic2 mutant. (a,b; d–g; i–l; o–r; t,u) in situ hybridisation. Genotype and age of embryos (expressed as somite number) are indicated. All images are oriented with the left side on the right of the photo and show the ventral surface of the embryo. Arrows indicate LPM, arrowheads: node. t and u are composite images. (c,h,m,n,s) Charts summarise the results of in situ experiments illustrating the relationship of expression pattern and expression level to embryo age and genotype. Each dot represents an individual embryo, blue dots are control embryos (+/+ and +/iso), red are mutants (iso/iso). A dark colour indicates strong expression while a lighter colour indicates weak or absent expression. Data are plotted as expression pattern (one of 4 categories shown on the x axis) against embryo age (expressed as somite number: 1 s, 2 s etc., y axis). HF = headfold stage. L = left, R = right.

