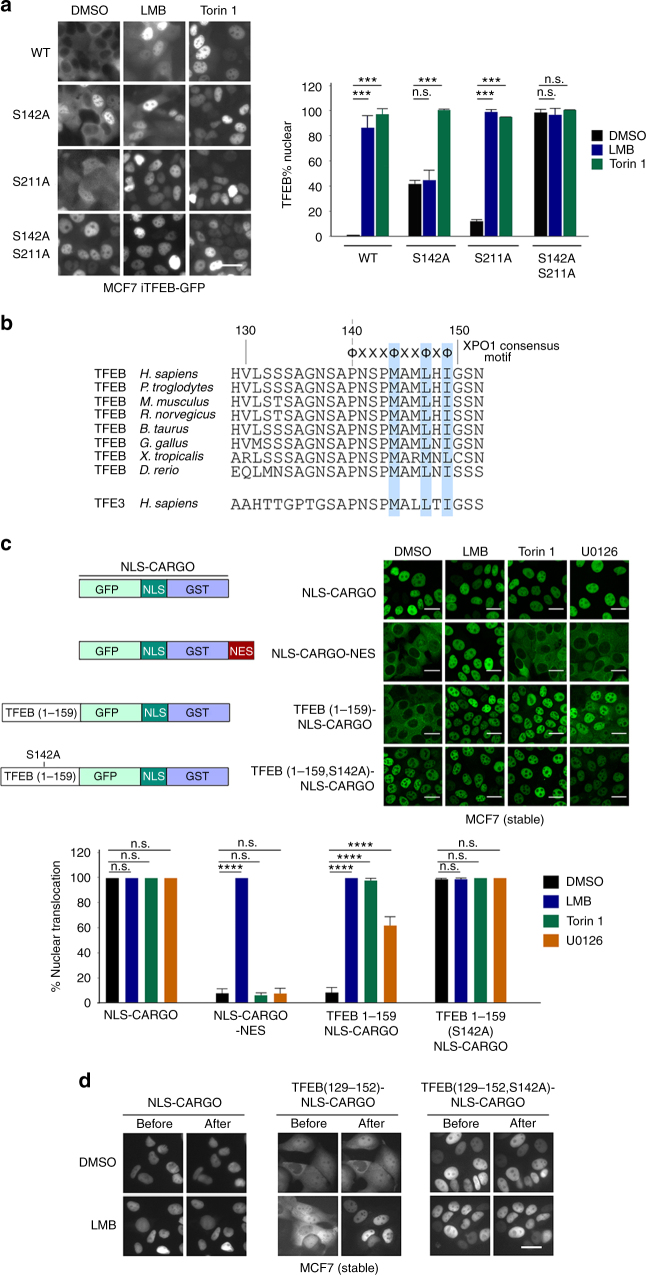
Fig. 2.
Identification of a TFEB nuclear export signal. a Live cell fluorescence images of indicated WT and mutant TFEB-GFP proteins in stably expressing MCF7 cells. Cells were treated with DMSO, LMB (20 nM; 2 h) or Torin 1 (20 nM; 1 h). n > 30 cells per condition. b Alignment of TFEB amino acids 129–152 and equivalent TFE3 residues. Amino acids highlighted in blue conform to the consensus for an NES. c Live cell fluorescence imaging of MCF7 cells stable expressing indicated fusion proteins imaged before or after treatment with LMB (2 h; 20 nM), Torin 1 (1 h; 250 nM), or U0126 (3 h; 20 μM). Imaging was performed after fixation. n > 50 cells per condition. Error bars = SD. Student’s t-test; ***P < 0.001, ****P < 0.0001, n.s. not significant. d Real time fluorescence imaging of MCF7 cells stably expressing the indicated fluorescent TFEB (129–152) cargo vectors before or after treatment with LMB (20 nM; 2 h). Scale bars = 20 μM

