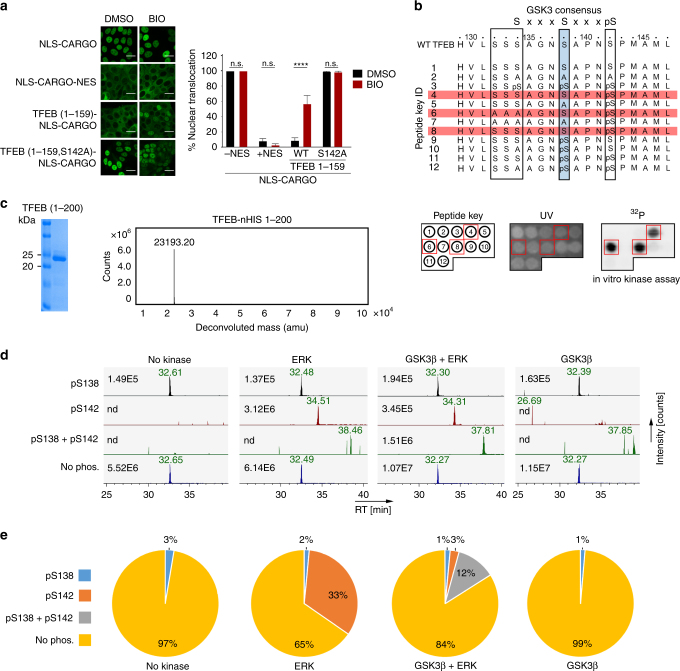
Fig. 4.
Phosphorylation at S142 primes for GSK3β phosphorylation at S138. a Fluorescence images of cells expressing indicated WT and mutant cargo vectors in the presence and absence of BIO (10 μM). n > 50 cells per condition. Error bars = SD. Scale bar = 20 μM. ****p < 0.0001, n.s. not significant. b TFEB amino acids 129–152 showing the GSK3β consensus sequence. The S138 GSK3β site is highlighted in blue, the ERK/mTOR phosphorylation site S142 is boxed, as are three additional potential GSK3β sites that could be primed by phosphorylation at S138. Peptides 1–12 were spotted onto a membrane (see key corresponding to peptides in lower left panel) and subject to GSK3β phosphorylation in vitro. Peptides highlighted in red were phosphorylated by GSK3β. Lower panels: Peptide key corresponding to peptides above spotted onto a membrane (left) and visualized by UV (middle). The result of the GSK3β kinase assay is shown in the right panel and the red boxes correspond to phosphorylated peptides highlighted in red above. c Coomassie-stained gel of bacterially expressed and purified 6xHIS-tagged TFEB amino acids 1–200 (left) and associated Mass Spec spectrum (right). d Extracted ion chromatograms of tryptic peptides covering S138 and S142 in their differential phosphorylation states after indicated kinase treatment. A peptide with a single phosphorylation on S138 was detected at low intensity in all samples, including those not treated with GSK3β, while a peptide with a phosphorylation event on S142 was only detected in the ERK and GSKβ + ERK treated samples. Peptides dually phosphorylated on both S138 and on S142 were detected only after GSKβ + ERK treatment. Numbers represent maximum ion count for each peptide/phospho-peptide. e Quantification of TFEB in vitro kinase/Mass Spec data. The pie-charts illustrate the signal contribution of each (phospho-)peptide variant to total signal intensity covering the analyzed phosphorylation locus after kinase treatments. Assuming that each peptide variant has identical ionization characteristics, the charts reflect the stoichiometry of the different phospho-proteoforms of TFEB after kinase treatment

