Fig. 7.
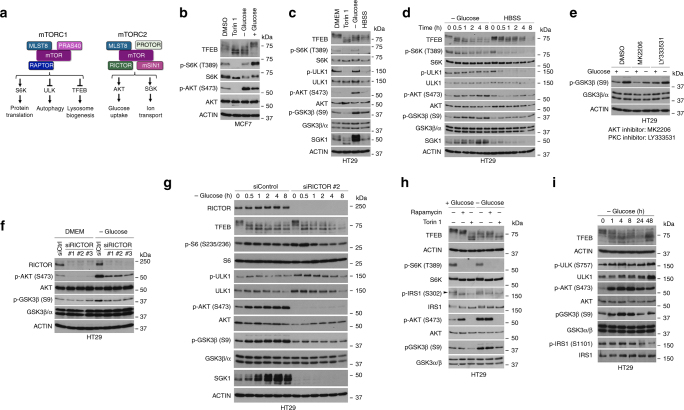
mTORC2 regulates GSK3β in response to glucose limitation. a Schematic showing the mTORC1 and mTORC2 complexes and downstream targets. b–d Western blots using indicated antibodies of HT29 cells grown under indicated conditions. Unless otherwise indicated cells were placed in HBSS for 2 h, or treated with Torin 1 (250 nM) or starved of glucose for 2 h and where indicted refed glucose for 1 h. e Western blot using indicated antibodies of HT29 cells grown in DMEM or starved of glucose for 4 h and treated with DMSO, MK2206 (3 μM), or LY333531 (5 μM). f Western blot using indicated antibodies of HT29 cells. 48 h after transfection with RICTOR-specific or control siRNAs cells were glucose starved for 2 h, as indicated. g Western blot using indicated antibodies of HT29 cells transfected with control or RICTOR-specific siRNA for 48 h prior to glucose starvation for indicated times. h Western blot using indicated antibodies of HT29 cells grown in the presence of absence of glucose (4 h) of cells treated with Rapamycin (1 μM) or Torin 1 (250 nM). i Western blot using indicated antibodies of HT29 cells following glucose starvation for indicated times

