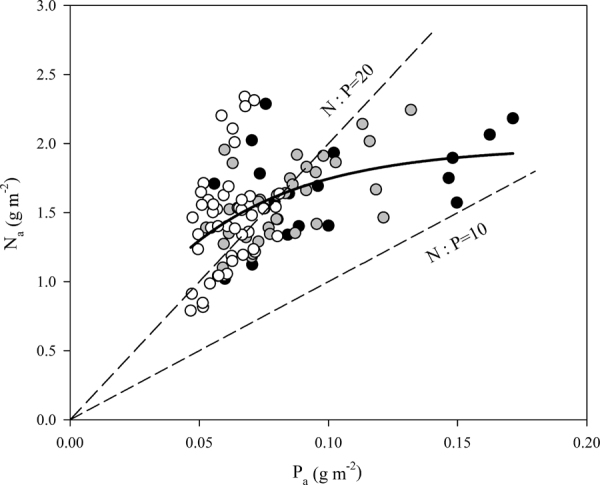
Figure 1.

The relationship between area-based leaf P concentration (Pa) and leaf N concentration (Na). Data points represent individual leaf values (19, 37, and 47 individuals from pioneer, generalist, and climax species, respectively). Dashed lines represent the N:P ratios of 10 and 20. Points above the N:P = 20 indicate P limitation; points below the N:P = 10 line indicate N limitation; and points between the lines indicate co-limitation. Symbols: pioneer species (solid); generalist species (grey); climax species (open).
