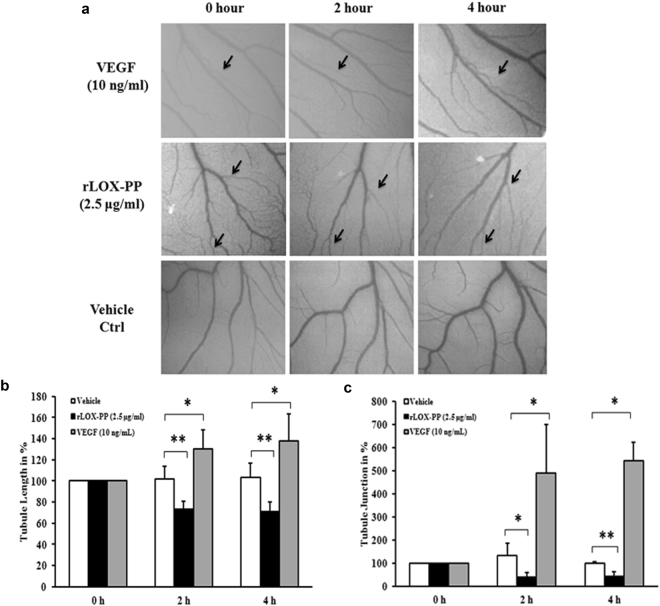
Figure 11.
Effect of rLOX-PP in in vivo angiogenesis CAM assay: (a) Representative photographs showing the rLOX-PP (2.5 μg/ mL) treated CAM, vehicle ctrl treated CAM and 10 ng/ml of VEGF treated CAM (positive control) at 0 h, 2 h and 4 h. (b) Quantification of the blood vessels in terms of measuring tubule length and (c) tubule junction. Vessel length and junction were noted (indicated in arrow) in each CAM and changes are shown in percentage in relation to the vehicle ctrl. Values are expressed as mean ± SD, n = 3. **p < 0.01 and *p < 0.05 versus Vehicle ctrl. *p < 0.05 versus 10 ng/mL of VEGF. (Vehicle ctrl – Vehicle control).

