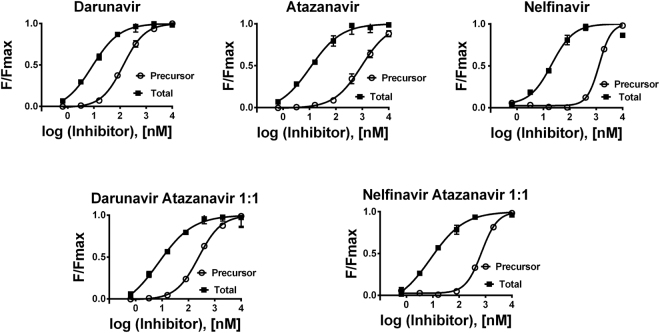
Figure 4.
Dose response curves: Flow cytometry analysis of HEK293T cells transiently transfected with the mCherry-PRprec-EGFP reporter harboring wild-type HIV-1 protease and treated with an appropriate concentration of inhibitor(s). In the case of PI mixtures, the ratio of inhibitors was 1:1. The mCherry signal (measured at 610 nm upon excitation at 561 nm) corresponds to the total inhibition of all PR forms (precursor, partially cleaved precursor and mature form), whereas the FRET signal (measured at 695 nm upon excitation at 488 nm) corresponds to the amount of PR precursor. The mean fluorescence (F) for the appropriate inhibitor concentration was divided by the maximal reachable mean fluorescence (Fmax) of the transfected cells in the presence of the appropriate inhibitor.

