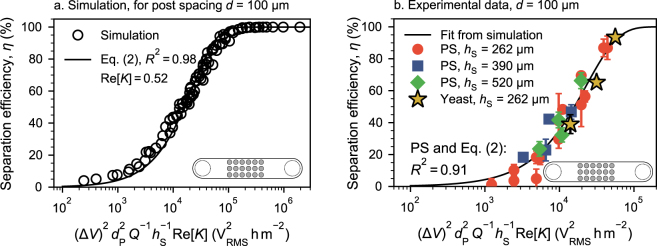
Figure 3.
Separation efficiency η as a function of . (a) Simulated separation efficiencies (empty symbols) for a variety of parameters Q = 0.05–0.1 mLh−1, dP = 0.2–1 μm, ΔV = 350–4000 VRMS, and hS = 130–1200 μm at Re[K] = 0.52 and d = 100 μm. The fit according to Eq. (2) shows a high R2 of 0.98 using Re[K] = 0.52. (b) Comparison of the fit from panel (a) with experimental data obtained using 1 μm polystyrene (PS) particles. Using the same and comparison with the PS experiments gives a slightly lower R2 of 0.91. The red circles of panel b are equal to the data points presented in Fig. 2a. The blue and green data points at hS = 390 μm and 520 μm were recorded at ΔV = 700–1050 VRMS and Q = 0.1–0.2 mLh−1. Particle size dP = 1 μm in all experiments. Again, a value of Re[K] = 0.52 was assumed for the PS particles to match the experiments with the simulation. The yellow stars show the separation efficiency of yeast cells (dP = 5 μm, Q = 0.6 mLh−1, hS = 262 μm and ΔV = 700–1050 VRMS). Here, a value of Re[K] = 0.18 was assumed to obtain a match between the fit and the experimental data. The Methods section gives a detailed explanation on how we obtained the values of Re[K] for yeast and PS. In all cases, error bars show one standard error. If error bars are not visible, they are smaller than the symbols. A version of panel b containing a numbering scheme and a corresponding table that contains the respective hS and ΔV values can be found in the supplementary information (Fig. S12 and Table S2).

