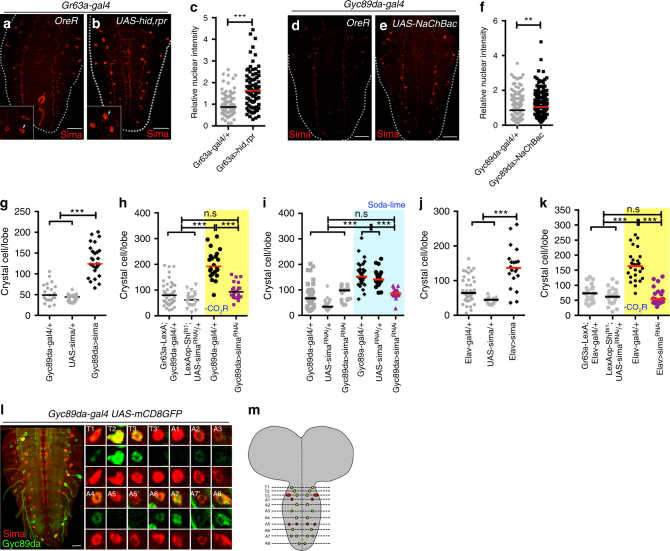
Fig. 3.
Sima (Hifα) stabilization in HypSNs affects crystal cell number. c and f indicate the relative intensities of nuclear Sima, and Graphs in g–k indicate the number of CCs in a single lymph gland lobe. n.s: not significant (p > 0.01). *p < 0.01; **p < 0.001; ***p < 0.0001. Scale Bar: 50μm. Bars in graphs: the median. CO2SN inhibited conditions: –CO2R with shaded yellow in h, k, and Soda-lime generated low CO2: shaded blue in i for clarity. a–c Inhibition of the CO2SN elevates Sima expression in the VNC. Control brains (Gr63a-gal4/ + ) exhibit very low Sima expression in the VNC (Sima is in red) (a). Genetic ablation of CO2SN (Gr63a-gal4; UAS-hid,rpr) leads to 2-fold increase in accumulation of nuclear Sima in specific VNC cells (white arrows in inset) (b). Quantitation of data shown in c. d–i Activation of HypSNs elevates Sima expression in the VNC. Control brains (Gyc89da-gal4/ + ) show very low Sima expression (d). Constitutive activation of HypSNs significantly increases accumulation of nuclear Sima in specific VNC cells (Gyc89da-gal4; UAS-NaChBac) (e). Quantitation of relative nuclear Sima intensity shown in f. CC differentiation is significantly enhanced when sima is overexpressed in HypSN cells (Gyc89da-gal4; UAS-sima) (g). simaRNAi expressed in HypSNs suppresses the extra CC differentiation phenotype caused by loss of CO2SN function (Gr63a-LexA, LexAop-Shits1; Gyc89da-gal4, UAS-simaRNAi) (h). This rescue is also seen upon loss of sima in HypSNs when animals are grown in low CO2 (soda-lime) condition (i). j-k sima expression in neurons is linked to CC differentiation. Larvae expressing sima in the brain (Elav-gal4; UAS-sima) facilitates CC differentiation (j). Also, increased CC differentiation caused by CO2SN inhibition is rescued by concurrent inhibition of sima in the brain (Gr63a-LexA, LexAop-Shits1; Elav-gal4, UAS-simaRNAi) (k). l, m Sima co-localizes with a subset of HypSNs. Within the VNC, neurons express Sima in total 14 pairs per hemineuromere from T1 to A8. Amongst these, 10 pairs co-localize with Gyc89da in the T1-T3, A2-A4 and A6-A8 (Gyc89da-gal4; UAS-mCD8GFP). A magnified view of Sima and Gyc89da-expressing neurons in the thoracic and abdominal ganglia (Sima, red; Gyc89da, green) (l). In the reconstructed image of VNC, Sima+ HypSNs are shown in yellow and Sima+ cells that are not HypSNs are marked in red (m)

