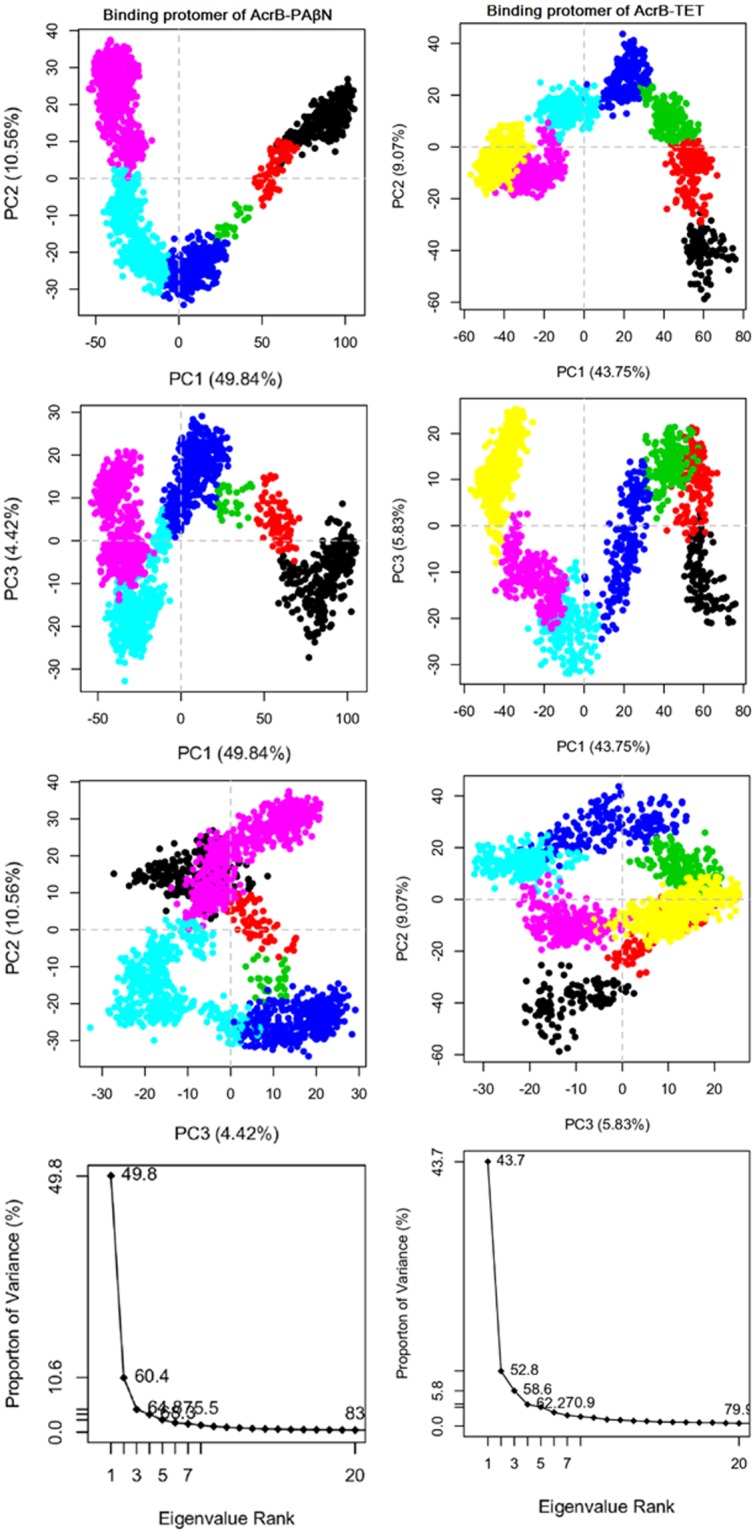
Figure 5.

Row (1–3) Conformer plot of PCA data colored by cluster after calculation of cluster groups in binding protomer of AcrB-PAβN (left panels) and AcrB-TET (right panels); Row (4) The rank ordering of the eigenvalues of the covariance matrix. Eigenvalue spectrum: Results obtained from diagonalization of the atomic displacement correlation matrix of Cα atom coordinates from the first snapshot structures. Inset shows histograms for the projection of the distribution of structures onto the first six principal components.
