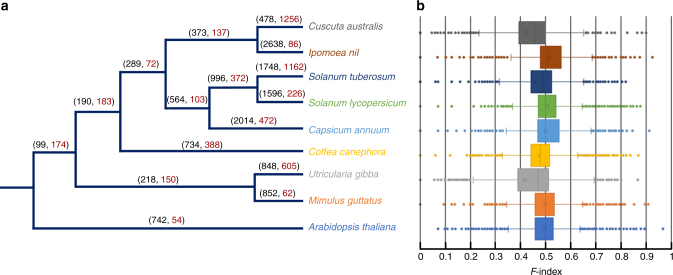
Fig. 2.
Expansion and contraction in C. australis gene families. a Significantly expanded and contracted gene families. Brackets above each branch indicate numbers of expanded (in black, before comma) and contracted (in red, after comma) gene families. b Tukey boxplot overview of the differences among the gene numbers of the conserved gene families, based on the F-index values (F-indices range from 0 to 1; when F = , < , or > 0.5, the gene number in the given gene family is equal to, smaller, or greater than the average size of this gene family in all species). The left and right sides of the boxes are the first and third quartiles, respectively; means and medians of the data are shown as an “ × ” and the bands in the boxes, respectively; for each box, the whiskers represent the smallest and biggest datum that are still within 1.5 times interquartile range of the lower and upper quartile, and the outliers are shown as dots

