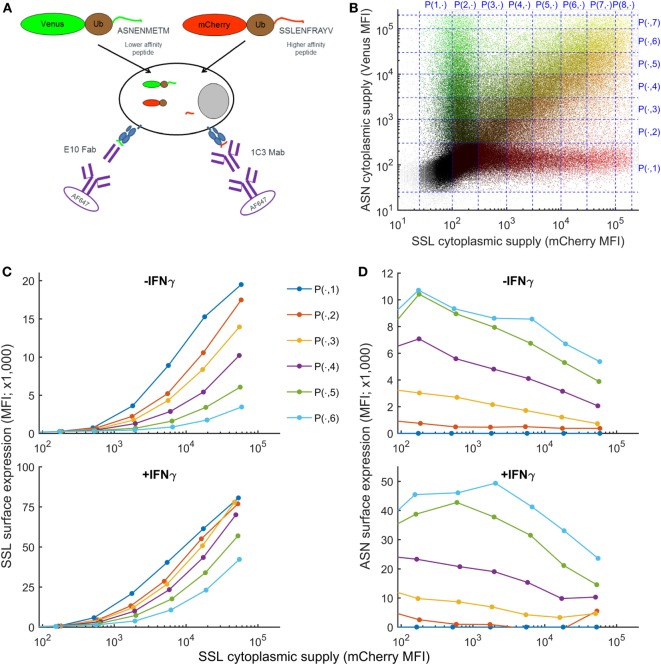
Figure 1.
Simultaneous measurement of intracellular peptide abundance and cell surface peptide–MHC complex (pMHC). (A) Experimental setup. Fibroblasts were co-transfected with constructs expressing fusion proteins made of a fluorescent protein, ubiquitin, and a peptide. Cytoplasmic ubiquitin hydrolases cleave the fusion proteins, releasing an equimolar ratio of peptide and fluorescent protein. Peptides are transported to the endoplasmic reticulum where they can compete for loading onto MHC-I molecules. Then they migrate to the cell surface where ASNENMETM-H2Db complexes can be detected using E10 Fab and SSLENFRAYV-H2Db using the 1C3 chimeric Mab followed by a secondary antibody conjugated to AF647. (B) In a single transfection assay, cells were expressing low to high levels of both fusion proteins and were separated in different gates for the purpose of the analysis. (C) Level of SSLENFRAYV-H2Db surface expression in the presence of increasing amount of competitor. The dark blue curve shows the maximum surface expression as the cytoplasmic level of SSLENFRAYV peptide, represented on the x-axis, increases. The other curves represent the SSLENFRAYV-H2Db surface expression in the presence of different levels of ASNENMETM competitor [top dark blue curve corresponds to gates P(1, 1) to P(8, 1) with no competitor, down to the light blue bottom curve corresponding to gates P(1, 8) to P(8, 8) with the maximum level of competitor] in untreated wild-type cells (top panel) or in IFNγ-treated cells (bottom panel). (D) Corresponding ASNENMETM-H2Db surface expression.

