Figure 3.
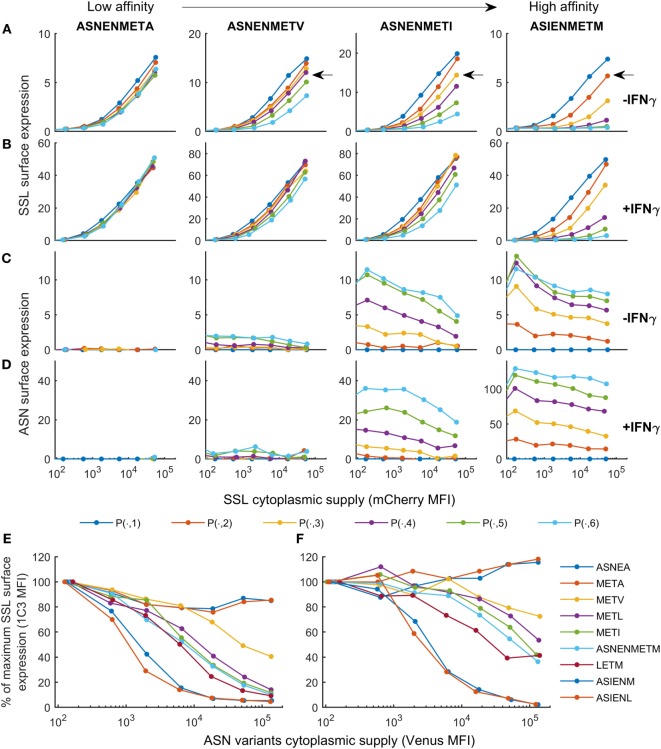
Cell surface abundance is differentially affected by competitor peptides with varying major histocompatibility complex stability. SSLENFRAYV-H2Db surface expression in the presence of ASN-variant peptides of different off-rates in untreated cells (A) and in cells treated with IFNγ (B) and corresponding ASN variants-H2Db surface expression in untreated cells (C) or in cells treated with IFNγ (D). pMHC surface expression is plotted over the level of SSLENFRAYV peptide cytoplasmic supply, determined by the mCherry MFI, in the presence of increasing concentrations of the ASN variant peptides: the dark blue curve is obtained with no ASN variant expression [gates P(n, 1)], the orange curve corresponds to gates P(n, 2), etc. The arrows on the top graphs show a similar competition level achieved with a high concentration of a lower affinity peptide (ASNENMETV) or lower concentrations of higher affinity peptides (ASNENMETI and ASIENMETM). (E,F) Comparison of the level of competition in the presence of an increasing concentration of each ASN-variant peptide at constant SSL supply [gates P(7, )]. In order to normalize MFI between experiments the y-axis represents the percentage of maximum SSLENFRAYV-H2Db surface expression in P(7, 1). The x-axis represents the cytoplasmic expression levels of each ASN variant expressed as the Venus MFI. Untreated cells (E) and IFNγ-treated cells (F) were compared.

