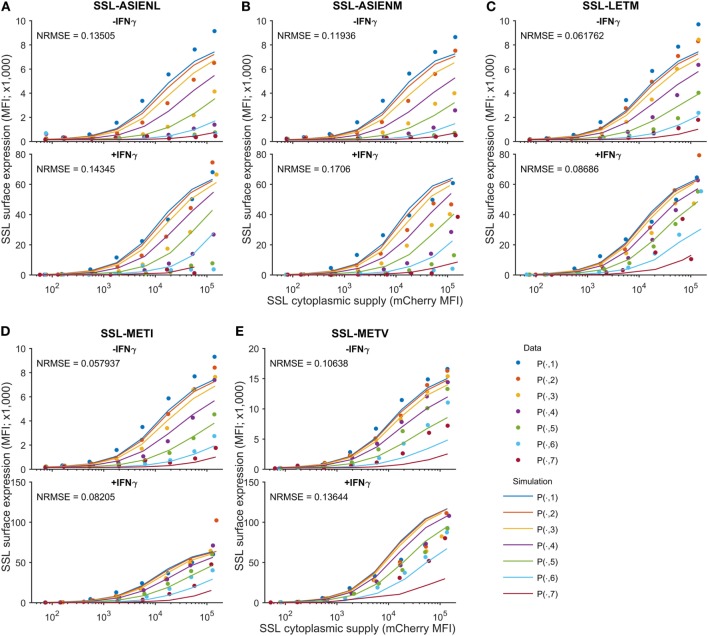
Figure 4.
Predicting cell surface presentation between peptide competitors. Using the calibrated model, cell surface presentation was predicted for SSLENFRAVY competing against variants of the ASNENMETM peptide, by changing the peptide off-rates to the measured values in Table 1. Shown are predictions and measurements for cell surface presentation of SSLENFRAYV, both in untreated (top panels) and IFNγ-treated (bottom panels) cells, when competing against ASN variant peptides (A) ASIENLETM, (B) ASIENMETM, (C) ASNENLETM, (D) ASNENMETI and (E) ASNENMETV. Predictions of the cell surface presentation of ASNENMETM variants are shown in Figure S8 in Supplementary Material. Different colored traces represent different cytoplasmic levels of the competing ASNENMETM variant, as indicated in Figure 1B. The normalized root mean-squared error (NRMSE) between the data and the simulation is also shown for each panel.

