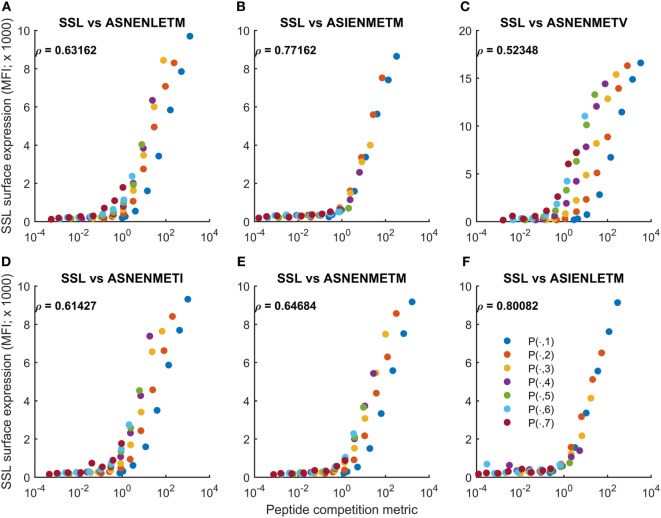
Figure 5.
Cell surface abundance can be predicted by a peptide competition metric. The peptide competition metric Fratio (Eq. 3) was calculated using measurements of cytoplasmic peptide abundance for SSLENFRAYV and variants of ASNENMETM (fluorescence units in Figures 1 and 3). Fratio (horizontal axis) was then compared with experimental measurements of cell surface abundance of SSLENFRAYV (vertical axis). Different colored traces represent different cytoplasmic levels of the competing ASNENMETM variant, as indicated in Figure 1B. A to F represent competitions between SSLENFRAYV and ASNENLETM (A), ASIENMETM (B), ASNENMETV (C), ASNENMETI (D), ASNENMETM (E) and ASIENLETM (F).

