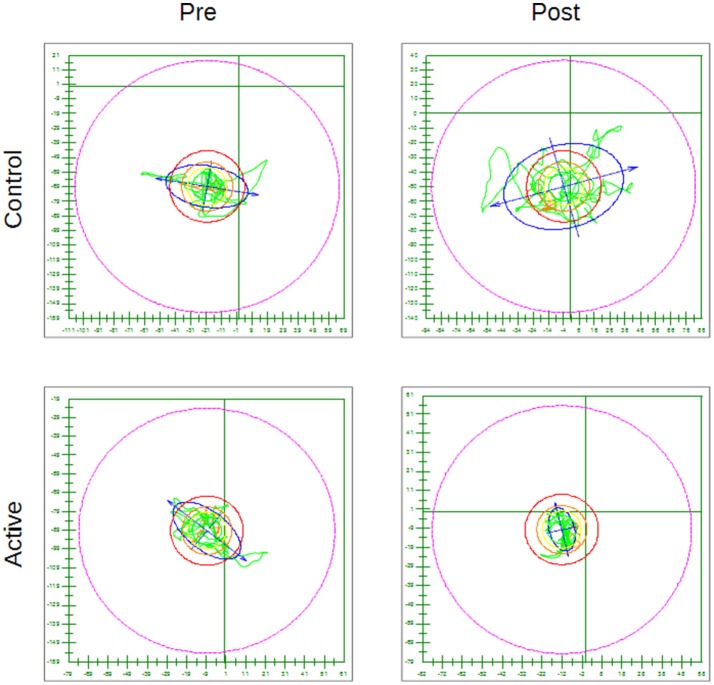
Figure 5.
Examples of CoP trace for the hard surface eyes open condition pre and post treatment for a subject in the Control group and for one in the Active group—The outer circle represents 100% of the theoretical limit of stability for the individual subject. Everything else is scaled accordingly.

