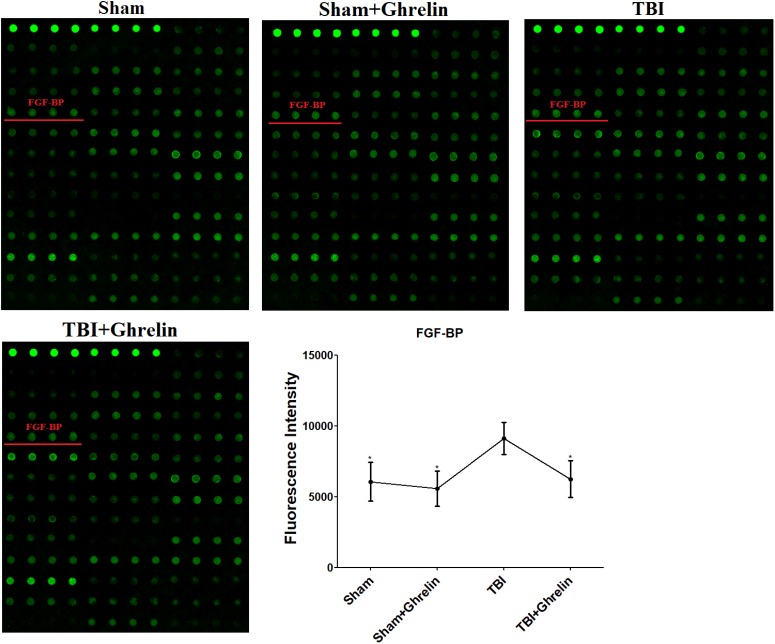
FIGURE 5.
Antibody array profiles and expression levels of FGF-BP among the four groups. FGF-BP was detected with a RayBio Rat Cytokine Antibody Array 4, a glass series array. FGF-BP location in the array is labeled by red underscores. The signal values of FGF-BP among the four groups is shown by line graphs. ∗p < 0.05 versus TBI group. Data are presented as means ± SD. n = 15 in each group.

