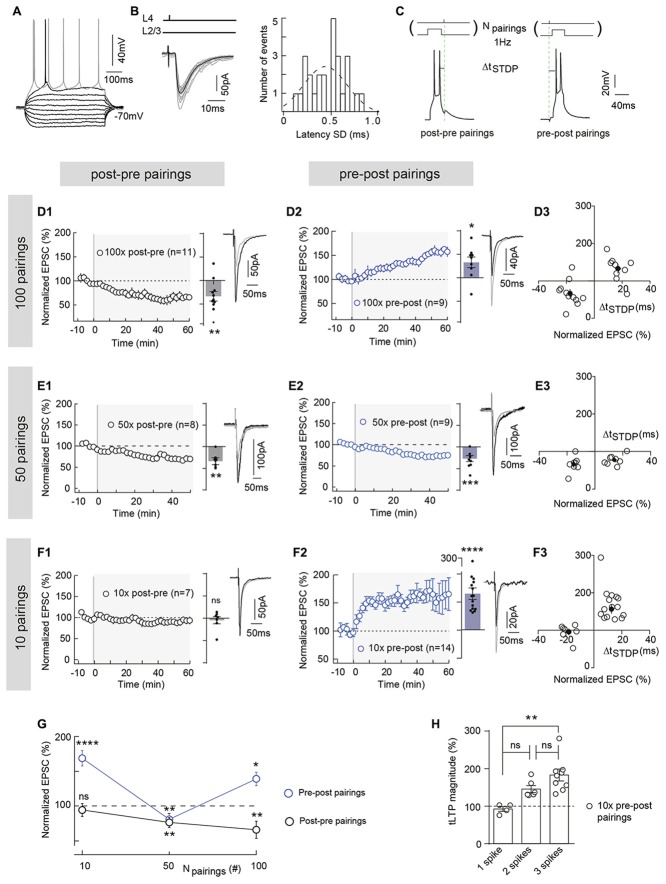
Figure 1.
Polarity of spike-timing dependent plasticity (STDP) varies upon number of pairings (Npairings) and Npairings = 10 induce spike-timing-dependent long-term potentiation (tLTP) in neocortical layer 2/3. (A) Characteristic voltage responses of a pyramidal cell to a series of 500 ms current pulses from −150 to +90 pA with current steps increasing by 30 pA (black traces) and to +60 pA above spike threshold (gray trace). (B) Cortically-evoked pyramidal cell EPSCs (averages of 15 traces; left panel). Distribution of latency SD, centered on 0.47 ms and fitted by a Gaussian function, indicate a monosynaptic cortical transmission because inferior to 1 ms (right panel). (C) Experimental design of STDP paired stimulations: two spikes evoked in pyramidal cell were paired with a single cortical layer 4 electrical stimulation; this pairing being repeated 10, 50 or 100 times at 1 Hz. ΔtSTDP indicates the time between pre- and postsynaptic stimulations. ΔtSTDP < 0 and ΔtSTDP > 0 refer to post-pre and pre-post pairings, respectively. (D) 100 pairings induced bidirectional Hebbian plasticity at neocortical layer 2/3 synapses. (D1,D2) Summary of timing-dependent long-term depression (tLTD) and tLTP induced by 100 post-pre (n = 11 cells from 8 rats; ΔtSTDP = −17 ± 2 ms) (D1) and 100 pre-post pairings (n = 9 cells from 6 rats; ΔtSTDP = +17 ± 2 ms) (D2), respectively. (D3) Graph summarizing STDP (bidirectional Hebbian) occurrence for 100 pairings. (E) 50 pairings induced symmetric anti-Hebbian tLTD. (E1,E2) Summary of STDP experiments showing tLTD for both post-pre (n = 8 cells from 5 rats; ΔtSTDP = −15 ± 1 ms) (E1) and pre-post (n = 9 cells from 5 rats; ΔtSTDP = +14 ± 2 ms) (E2) pairings. (E3) Graph summarizing STDP (symmetric anti-Hebbian tLTD) occurrence for 50 pairings. (F) 10 pairings induced unidirectional Hebbian plasticity. (F1,F2) Summary of STDP experiments showing the absence of STDP and tLTP induced by 10 post-pre (n = 7 cells from 3 rats; ΔtSTDP = −16 ± 2 ms) (F1) and 10 pre-post (n = 15 cells from 6 rats; ΔtSTDP = +13 ± 1 ms) (F2) pairings, respectively. (F3) Graph summarizing STDP (unidirectional Hebbian) occurrence for 10 pairings. (G) Summary graph illustrating the cortical STDP expression and polarity for 100, 50 and 10 post-pre and pre-post pairings. (H) Relationship between the number of postsynaptic action potentials (per pairing) and the synaptic efficacy changes after 10 pre-post pairings (one way analyses of variance (ANOVA) test, p = 0.0027, F = 8.794. 1 spike vs. 2 spikes, p = 0.0892; 2 spikes vs. 3 spikes, p = 0.1545; 1 spike vs. 3 spikes, p = 0.0020). Representative traces are the average of 15 EPSCs during baseline (black traces) and 50 min after STDP protocol (gray traces). Error bars represent SD. *p < 0.05; **p < 0.01; ***p < 0.005; ***p < 0.0001. ns, not significant.

