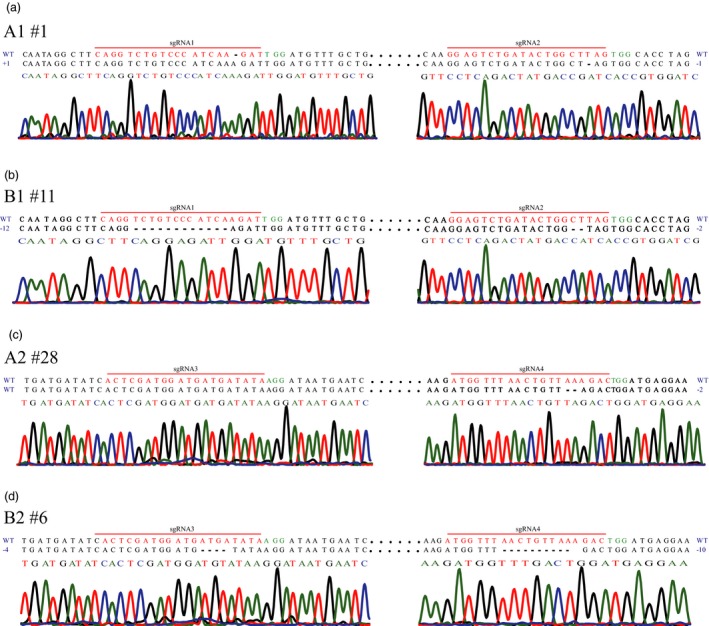
Figure 3.

Sanger sequencing of site‐specific mutations in kiwifruit. Sequences from selected callus lines with site‐specific mutations accompanied by corresponding regions of the sequencing chromatograms are shown. The nucleotide changes (dashes for deletion and WT for wild type) are also indicated on both sides of each sequence. Dots represent nucleotides that are not shown. (a) Site‐specific editing at sgRNA1 and sgRNA2 induced by the CRISPR/Cas9 system. The sequencing chromatograms at the sgRNA2 region were the results sequenced from the reverse direction. (b) Site‐specific editing at sgRNA1 and sgRNA2 induced by the PTG/Cas9 system. The sequencing chromatograms at the sgRNA2 region were the results sequenced from the reverse direction. (c) Site‐specific editing at sgRNA3 and sgRNA4 induced by the CRISPR/Cas9 system. (d) Site‐specific editing at sgRNA3 and sgRNA4 induced by the PTG/Cas9 system.
