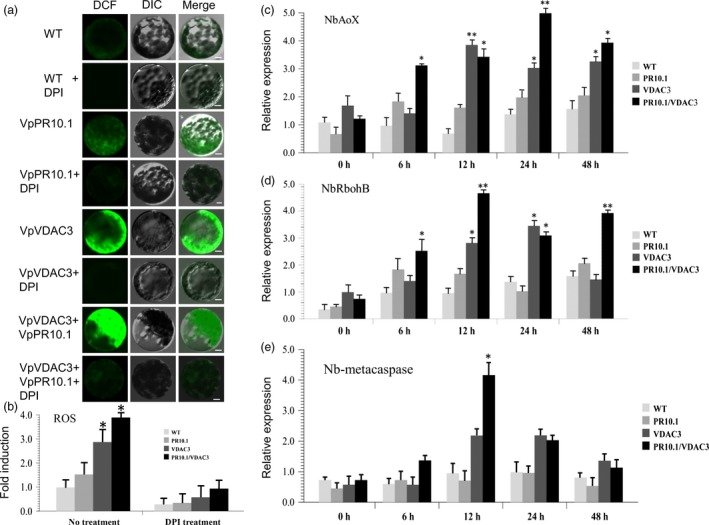
Figure 3.

ROS Detection of Transient Expression of VpVDAC3, VpPR10.1, VpVDAC3/VpPR10.1 in N. benthamiana. Before the separation of protoplasts, Flag‐VDAC3, Flag‐VpPR10.1 and Flag‐VpVDAC3/Flag‐VpPR10.1 were transiently expressed by Agrobacterium infiltration in N. benthamiana leaves. (a) Protoplasts isolated from the indicated transient expression leaves, and protoplast lines were marked by DCFH‐DA. The green fluorescence represents intracellular ROS level; (b) Each sample was accompanied by pretreatment of ROS inhibitor DPI. Bars = 10 μm. (c, d, e) Quantification of RT‐PCR analysis of ROS‐related genes NbAOX, NbRbohB, NbAPX; values represent means and SEs of three biological replicates. * and ** indicate P < 0.05 and P < 0.01, compared to GFP control (t‐test).
