Figure 7.

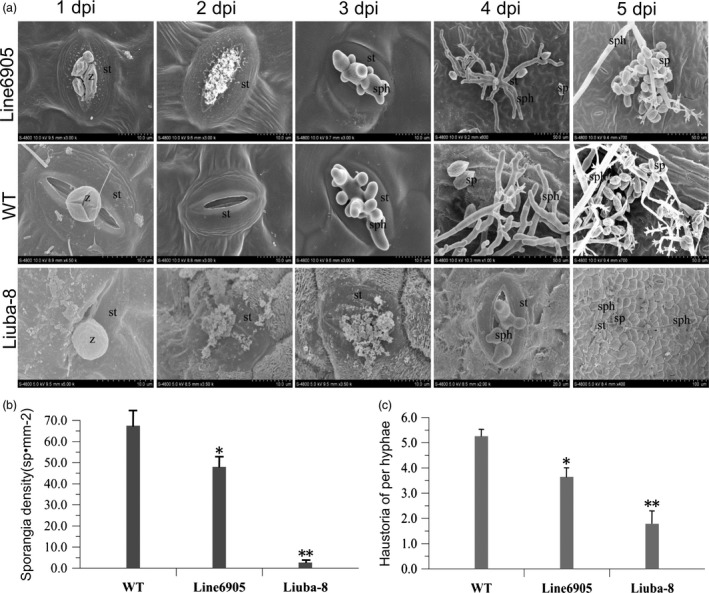
Overexpression of VpPR10.1 limits the development of Plasmopara viticola. The sporangia of P. viticola were attached to the back of leaf discs surface from WT and the overexpressing VpPR10.1 line 6905. P. viticola highly resistant Vitis piasezkii ‘Liuba‐8’ was used as positive control. (a) Scanning electron microscopy observation of VpPR10.1 transgenic line 6905 and WT leaves inoculated with P. viticola from 1 to 5 dpi. Images represented three independent experiments, z, zoospores encystment; st, stomata; sp, sporangia; sph, sporangiophores; hy, hyphae. (b) Average sporangia density of P. viticola from different genotypes at 5 dpi. Error bars indicate SE (n = 3) from three independent biological replicates (*P < 0.05 and **P < 0.01, t‐test). (c) Number of haustoria per hyphae on a total of 20 infected discs from different grapes at 48 hpi. Error bars indicate SE from three independent biological replicates (*P < 0.05 and **P < 0.01, t‐test).
