
Figure 4.
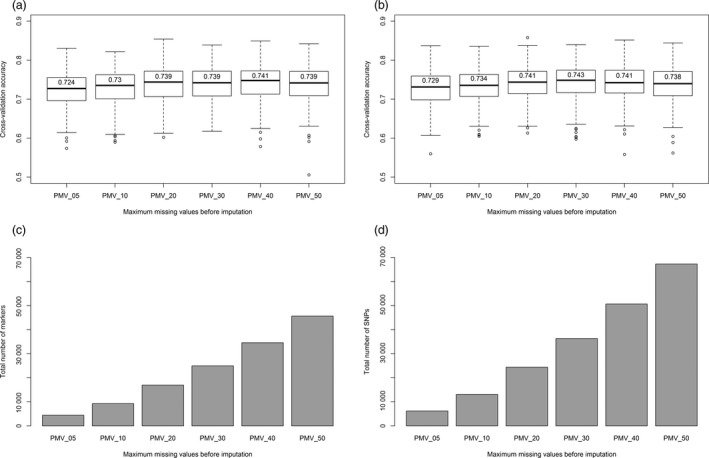
Prediction accuracy of the heading date BLUP using six levels of maximum percentage missing values (PMV) before imputation. Predictions using TL haplotype markers are shown on the left (a, c), while predictions with SNP markers are shown on the right (b, d). The bar graphs at the bottom (c, d) show the total number of markers used for the genomic selection model. The top boxplots (a, b) show the results of 500 iteration cross‐validation accuracies. The values on top of the median line show mean cross‐validation accuracies.