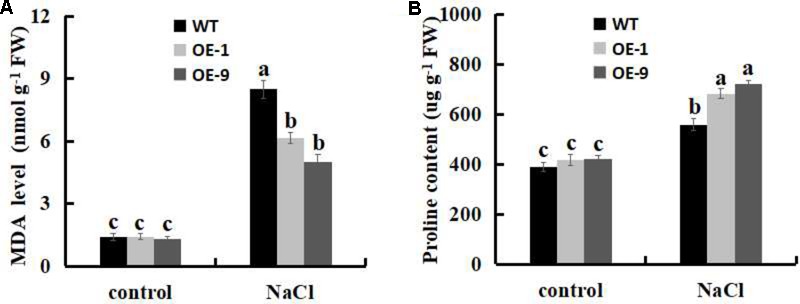
FIGURE 8.

Analysis of physiological indicators of lipid peroxidation (MDA) and proline in WT and SsbXoc transgenic N. benthamiana plants under salt stress. (A) MDA levels and (B) Proline contents in WT and transgenic plants after treatment with 0 and 200 mM NaCl for 4 d. Error bars represent SD, and values with different letters are significant at P < 0.05.
