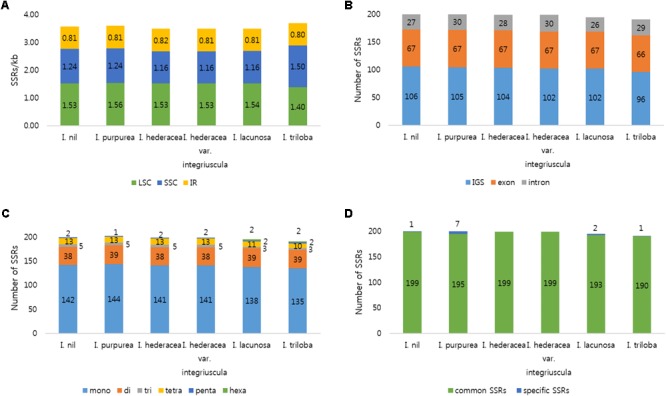
FIGURE 2.

Distribution of SSRs in the six Ipomoea chloroplast genomes. (A) Number of SSRs per unit length in genomic regions. (B) Distribution of SSRs in intergenic spacer (IGS), exon, and intron regions. (C) Distribution of SSR types. (D) Number of common and species-specific SSRs among the six Ipomoea chloroplast genomes.
