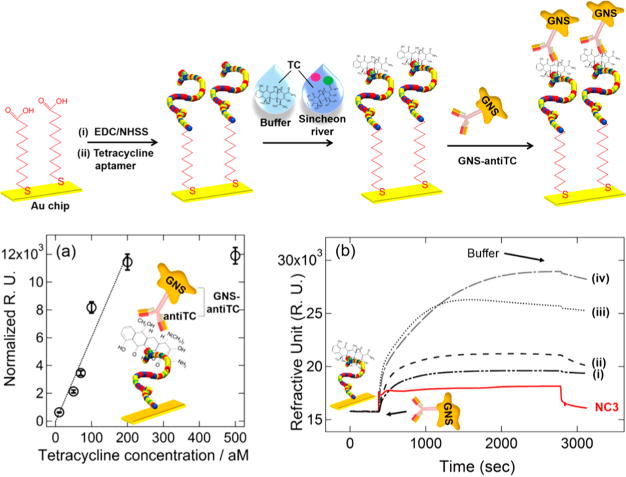
Figure 6.

(Top) Schematic overview of strategy for tetracycline (TC) detection. The TC aptamer was first immobilized on a SPR chip, followed by the covalent attachment of aptamer probes. TC binding was performed in both buffer and Sincheon river samples, followed by the subsequent binding of GNS antiTCs for further SPR signal amplification. (Bottom) (a) Monitoring changes in SPR response (normalized with respect to the average signal of NC signals) where the GNS concentration after the antiTC modification was fixed at 2.41 nM (optical density (OD) = 1.4) for a series of measurements where the SPR chip had already been exposed to different TC target concentrations from 10 aM to 500 aM in buffer. Each data point is the average of at least four repeat measurements. (b) Representative real-time SPR responses for different concentrations of TC. The concentrations of TC were (i) NC, (ii) 50, (iii) 70, (iv) 100 aM. Adapted from Kim, S.; Lee, H. J. Anal. Chem. 2017, 89, 6624–6630 (ref 115). Copyright 2017 American Chemical Society.
