
Figure 9.
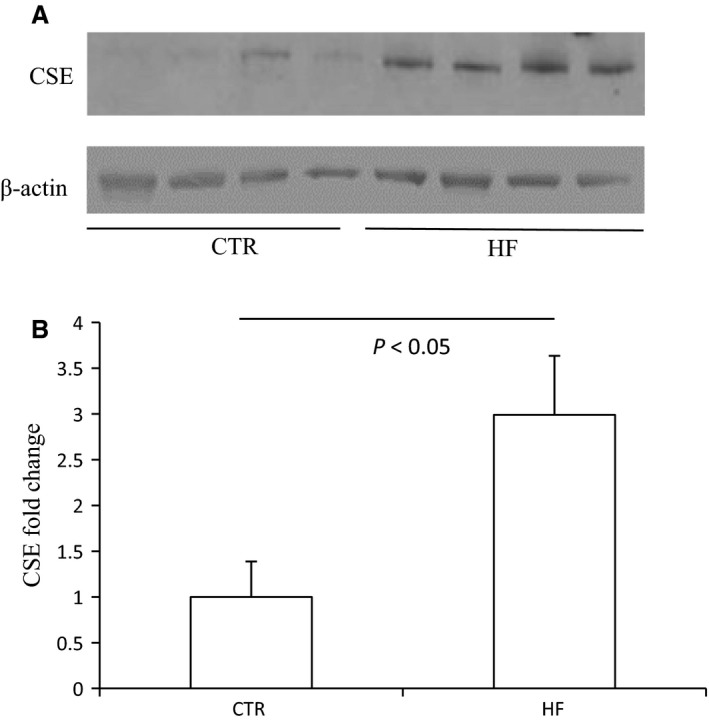
Effects of HFD on the protein expression of CSE and GLUT4 in epididymal fat. (A) Western blot analyses of CSE, GLUT4 and beta‐actin. (B) Densitometry of CSE. A densitometric ratio between the densitometry of CSE and beta‐actin was calculated, and data are expressed in comparison with the controls. (C) Densitometry of GLUT4. A densitometric ratio between the densitometry of GLUT4 and beta‐actin was calculated, and data are expressed in comparison with the controls. CTR, Control, n = 4; HF, High‐fat diet, n = 4. Data are means ± SE.