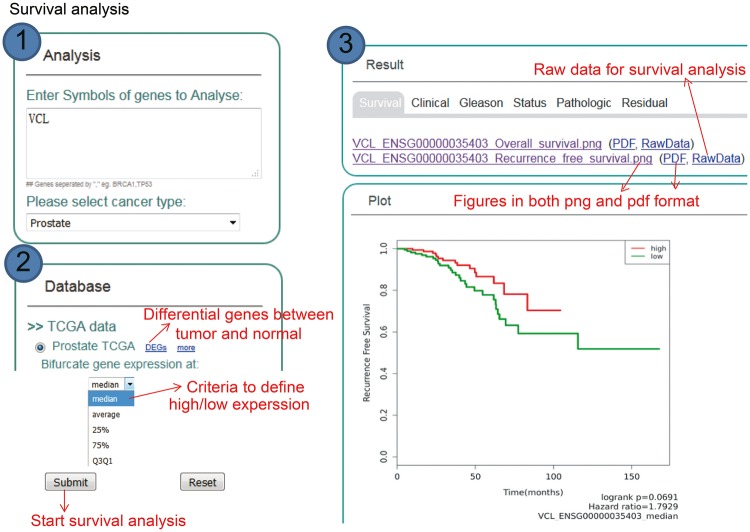
Figure 2.
Step-by-step usage of KM-Express for survival analysis. (1) Enter the gene symbol in the box provided. When users input multiple genes, gene symbols should be separated by ‘,’. The expression level of the multiple genes will be averaged and used for survival analysis. After the cancer type is selected, the RNA-seq data available for survival analysis will be shown in ‘Database’ panel. (2) Select the survival measure. The survival outcome is calculated as biochemical recurrence for tumor or without tumor for prostate cancer and dead or alive status for breast cancer. Next, select the criteria to divide the patients into two groups, one group highly expressing the input gene, the other group lowly expressing the input gene. For median/average/25%/75% cutoff, higher than the threshold corresponds to highly express group, others are lowly express group. For Q3Q1, highly expressed group represents patients with input gene expression >75% patients, while the lowly expressed group represents patients with input gene expression <25% patients. (3) The output provides KM-plot figures in both PDF and PNG format. The significance P-value and hazard ratio are provided in the figure along with the summary of input genes and user-selected parameters.

