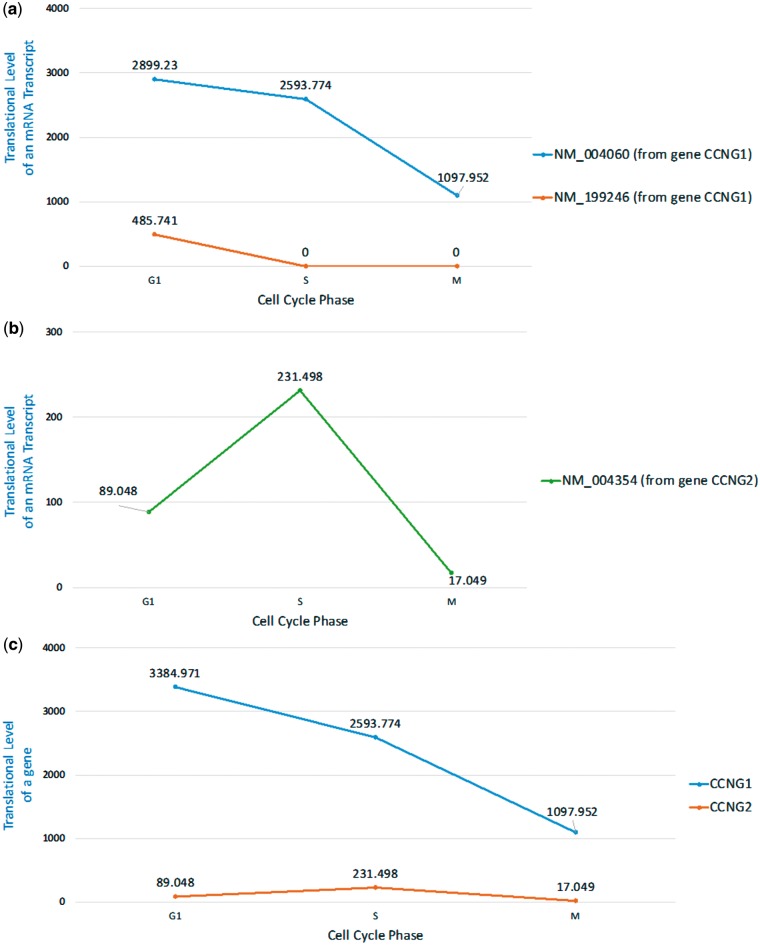
Figure 7.
Translational levels of the selected mRNA transcripts and genes in three selected cell cycle RPDs (G1 phase, S phase and M phase). (a) The translational levels of NM_004060 and NM_199246 (the two mRNA isoforms of the gene CCNG1) are shown. (b) The translational levels of NM_004354 (the mRNA transcript of the gene CCNG2) are shown. (c) The translational levels of the genes CCNG1 and CCNG2 are shown.

