
Fig. 3.
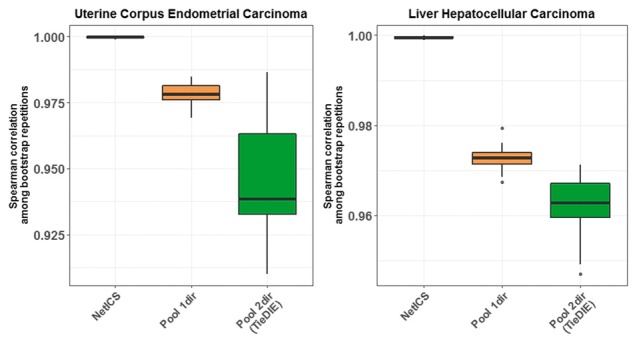
Stability of ranked gene lists. Shown are box plots demonstrating the stability between the ranked gene lists of each method among 10 bootstrap repeats. The boxes represent the average Spearman correlation (y-axis) between all possible pairs of the 10 ranked gene lists produced from the 10 bootstrap repeats. We compared three methods (x-axis) including NetICS, Pool1dir and Pool2dir. Stability was tested on the TCGA datasets of uterine corpus endometrial carcinoma (left) and liver hepatocellular carcinoma (right)