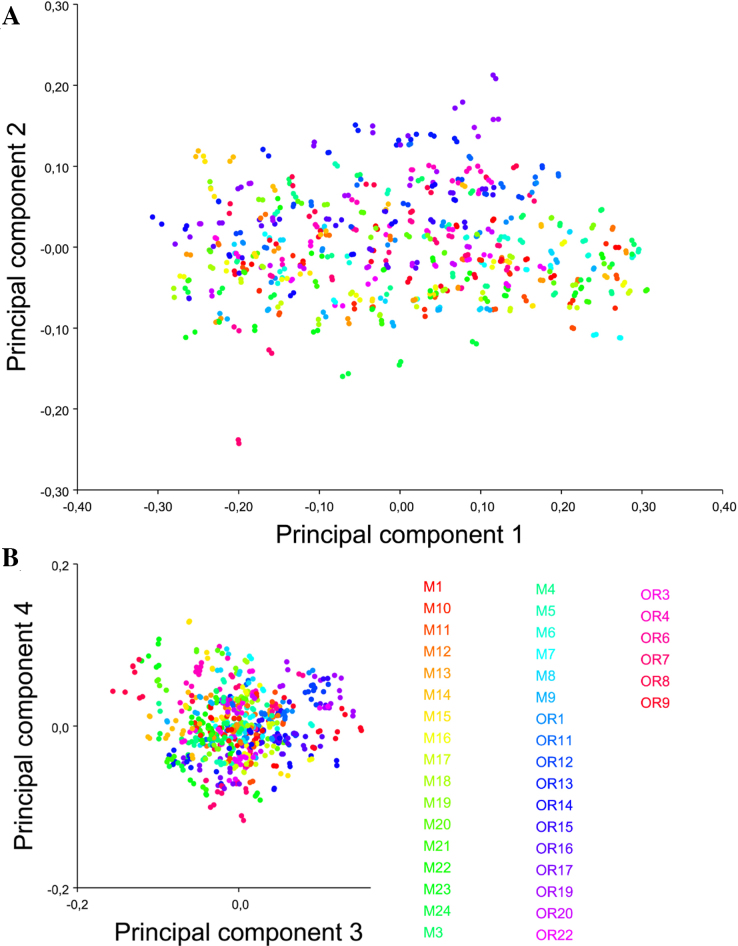
Figure 3:
Shape variation including all observations and replicas. PCA scatter plots of (A) PC1 vs. PC2 and(B) PC3 vs. PC4. Equally colored dots represent both digitizations of the same specimen for all DPIs. The scale factor for this graph is directly the magnitude of the shape change as a Procrustes distance in any given direction; the same scaling was used for all axes.

