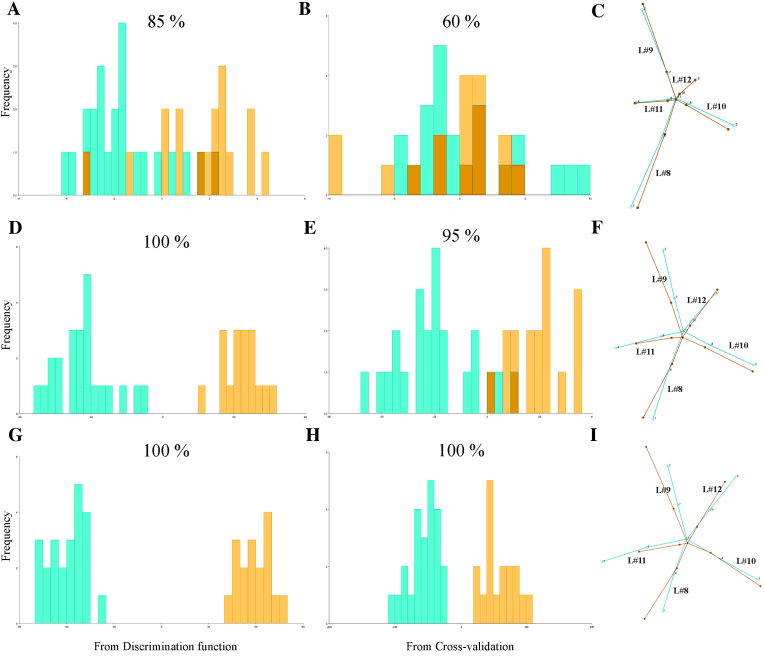
Figure 5:
Discriminant analyses of shape variation between treatments at 3 (A- C), 7 (D-F), and 12 (G-I)DPI. Frequencies of discriminant scores obtained by resubstitution rates of assignments (A, D, G) and a jackknife cross-validation (B, E, H) are shown using histogram bars with percentages of correct assignments above each graph. Wireframes comparing mean shapes (C, F, I) are shown magnified 2 times. Mock = bluish green; ORMV = orange.

