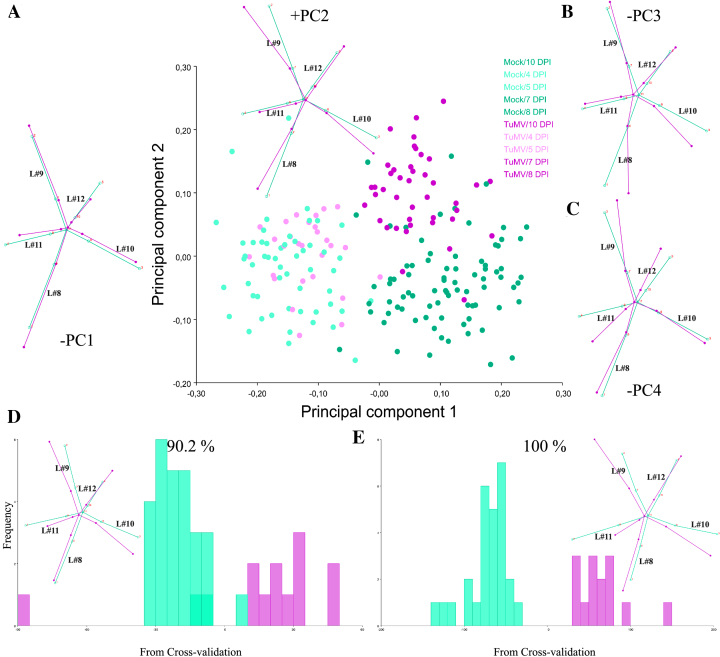
Figure 8:
Summary of GM analyses for TuMV-infected plants. (A-C) Shape variation between specimens. (A) PCA scatter plot (PC1 vs. PC2). Pale dots = juvenile (4–5 DPI) plants. Dark dots = mature (7–10 DPI) plants. Wireframe graphs from starting (average) shape (bluish green) to target shape (reddish purple) corresponding to –PC1 (to the left) and +PC2 (top) are included. (B-C) Wireframes for –PC3 and –PC4, respectively. (D-E) Frequencies of jackknifed discriminant scores for 7 and 10 DPI, respectively, with wireframes depicting shape changes included. Wireframes show starting shape (mock = bluish green) to the target shape (TuMV = reddish purple). Shape change is magnified 2x.

