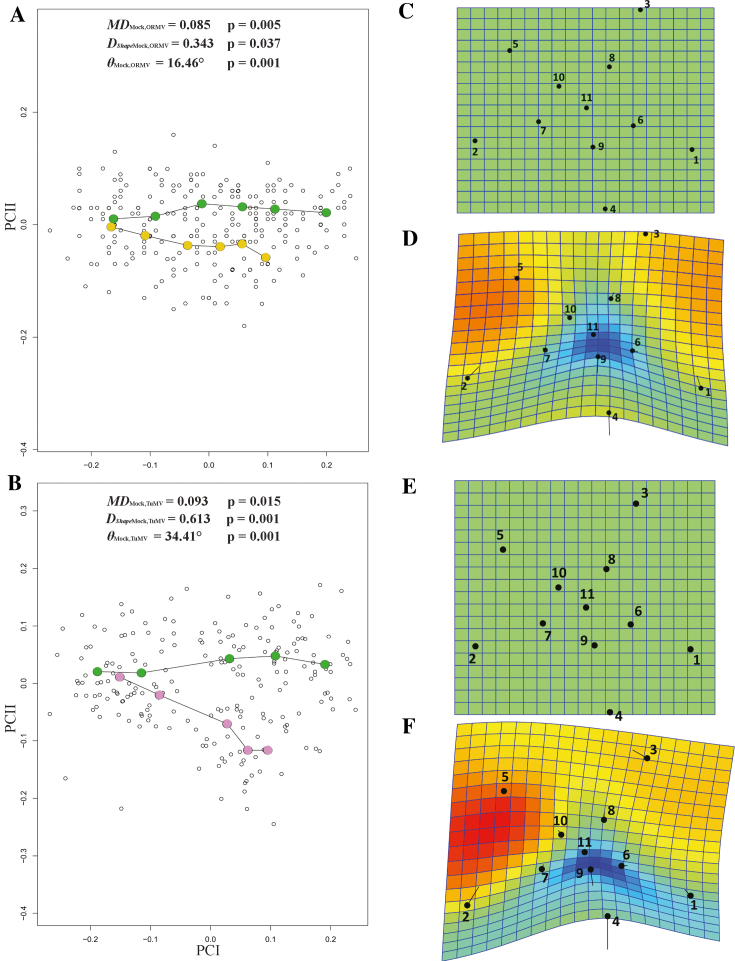
Figure 9:
Comparison of virus severity. PC plots of PTA for (A) ORMV- and (D) TuMV-infected plants compared with mock-inoculated plants (4–10 DPI). PTA parameters are shown (see main text). Transformation grids with lollipops and Jacobian expansion factors were executed in PAST [45] for ORMV- and TuMV-infected plants depicting (mean) shape change from controls to virus-infected plants (B to C and E to F, respectively) at 10 DPI. Jacobian expansion factors indicate expansions of the grid (yellow to orange red for factors >1) or contractions (blue for factors between 0 and 1). The same color scale was set for both comparisons. Lollipops indicate target position of landmarks with dots. Leaf 11 (landmarks 4, 9, and 11) is positioned at the bottom.

