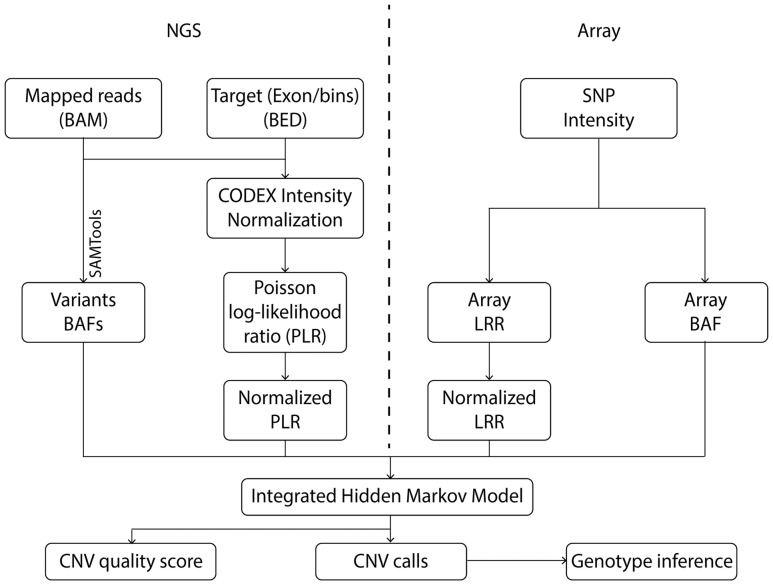
Fig. 1.
iCNV analysis pipeline including data normalization, CNV calling and genotyping using NGS and array data. For NGS data, the first step is to normalize coverage using CODEX and calculate a PLR, further converted to a normalized LRR by a z-transformation. The heterozygous single nucleotide positions are then found and BAF computed using SAMTools. For array data, we obtained lRRs and BAF from raw SNP intensity data and then normalized the LRRs. The integrated HMM takes these inputs and generates integrated CNV calls with quality scores. Finally, genotypes are inferred for each CNV region

