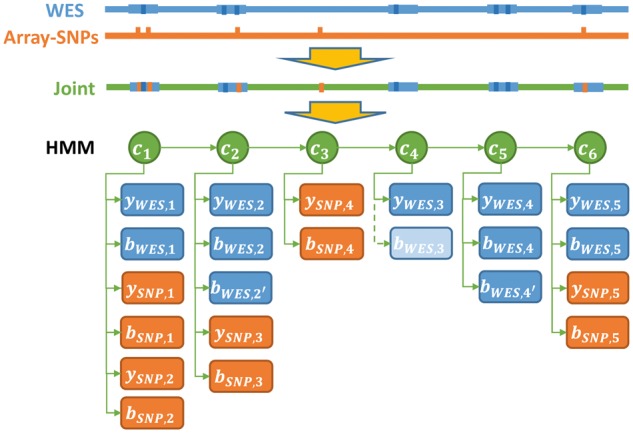
Fig. 2.

An illustration of the integrated HMM with array and WES data. indicates hidden states at position ; indicates observation of normalized intensity score at position ; indicates observation of BAF at position . Specifically in hidden state , since there is no variants BAF from WES, we assign 0
