
Fig. 3.
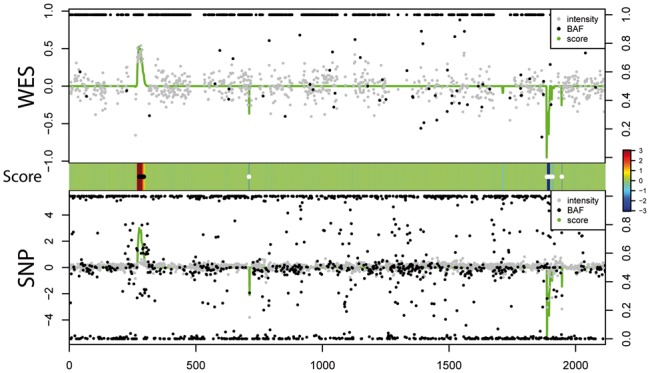
Case illustration of relationship between score (green line, range from −3, 3 and centered at 0, same as the middle panel), normalized intensity score (grey dots, left scale) and BAF (black dots, right scale) in WES and SNP array. Heat map in the middle indicates score and CNV calling (white dots: deletion; black dots: duplication)