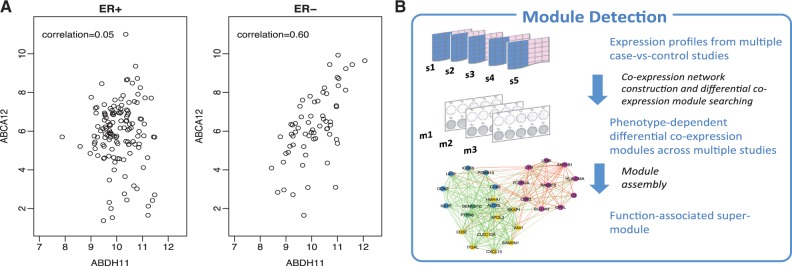
Fig. 1.
(A) An example of differential co-expression between ER+ and ER- breast cancers. Each dot represents one sample. Strong co-expression between ABCA12 and ABHD11 can be observed in ER- tumors (right) but not in ER+ tumors (left). Samples are from GSE7390. (B) Diagram of procedures for basic module detection by energy function optimization and supermodule assembly via pathway enrichment criterion (Color version of this figure is available at Bioinformatics online.)

