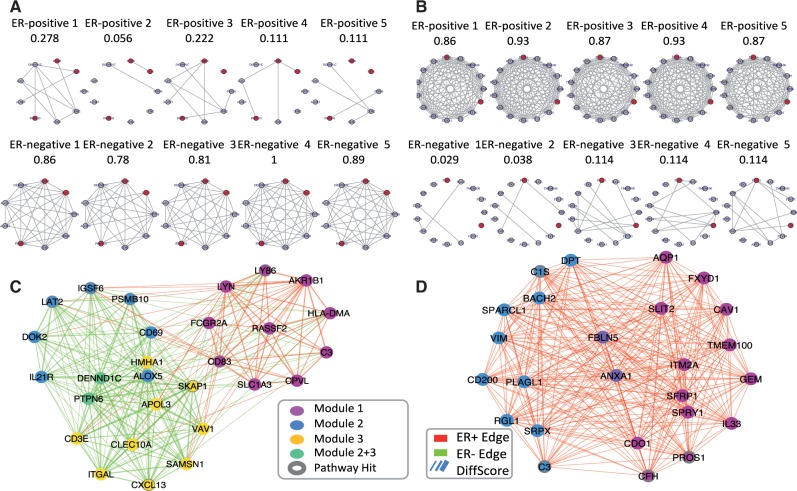
Fig. 2.
(A) Example module (L1) more densely connected in ER- group with red nodes indicate genes belonging to the immune response pathway. (B) Example module (H7) more densely connected in ER+ group with red nodes indicate genes belonging to the complement cascade pathway. Nodes represent genes and links between them represents co-expression relationship. Each column corresponds to one independent study. (C) Visualization of immune response pathway supermodule. (D) Visualization of complement cascades pathway supermodules. The edge color represents the direction of differential gene co-expression, in which positive values (red color) represent ER-positive-favored co-expression and negative values (green color) show ER-negative-favored co-expression. Node color represents its origin of sub-modules, and the genes annotated in the immune response pathway are highlighted with dark circles. Edge width represents edge weight (Z score of differential co-expression) (Color version of this figure is available at Bioinformatics online.)

