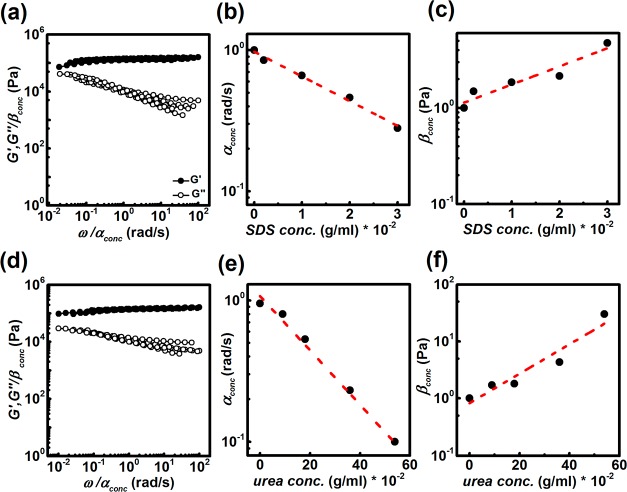
Figure 4.
Master curves of the frequency-dependent responses. (a) Master curve obtained after shifting the frequency sweep measurements when different amounts of SDS were added; (b) horizontal shift factor; (c) vertical shift factor, at varying SDS concentrations; (d) master curve obtained after shifting the responses when urea was used; (e) horizontal shift factor; (f) vertical shift factor, at varying urea concentrations. The dashed red lines in (b), (c), (e), and (f) represent the fitting.

