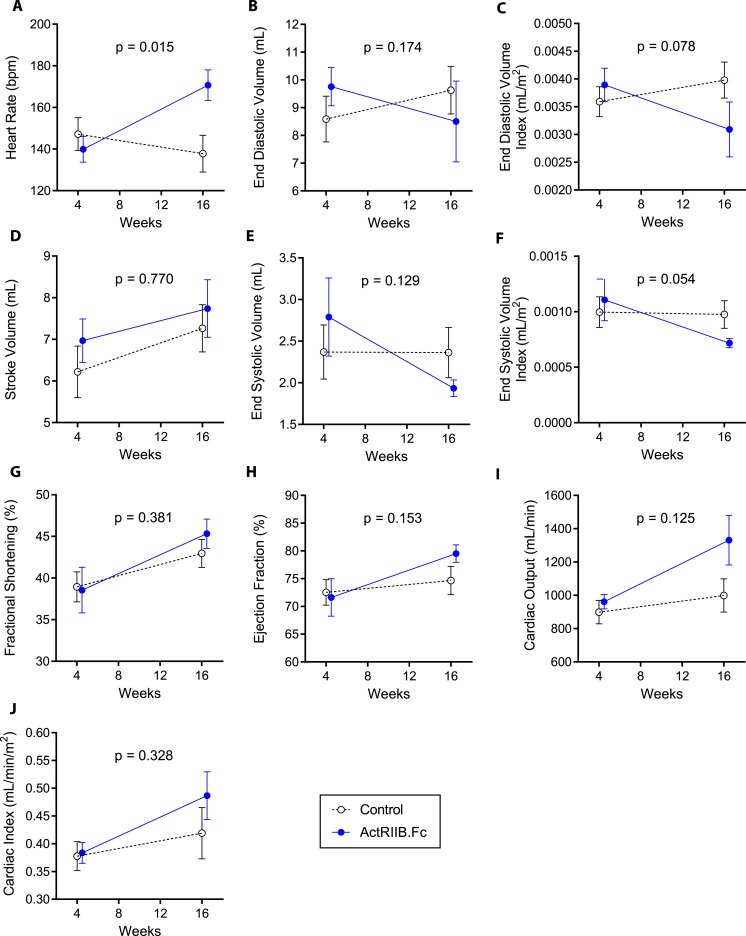
Figure 2.
Changes in (A) heart rate, (B) end-diastolic volume, (C) end-diastolic volume index, (D) stroke volume, (E) end-systolic volume, (F) end-systolic volume index, (G) fractional shortening, (H) ejection fraction, (I) cardiac output, and (J) cardiac index in both groups along the study. Data presented are means; error bars are SEM. The weeks represent time after SIV inoculation. Week 4 data represent the baseline data collected 4 weeks after SIV inoculation but immediately before starting the study interventions (ActRIIB.Fc or saline injections).

