Figure 3.

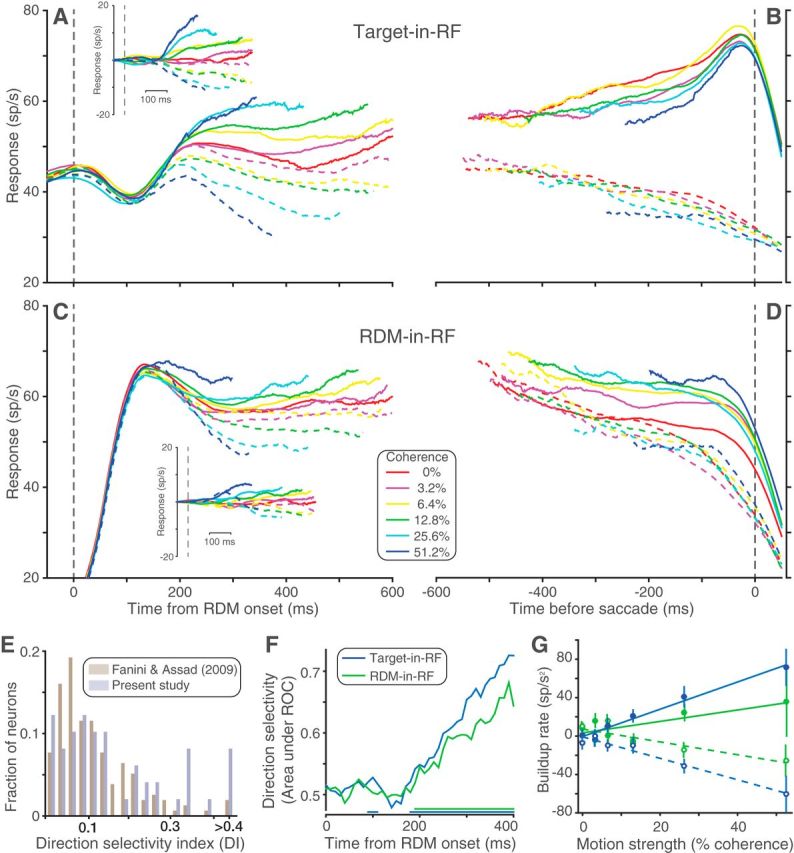
Neural population responses. Average response of the recorded neural population during Target-in-RF (A, B) and RDM-in-RF (C, D) configurations. A, C, Aligned to the onset of RDM and including all trials sorted by direction and strength of motion. Solid and dashed lines indicate responses to positive and negative motion directions, respectively (for conventions on sign of direction, see Experimental design and statistical analysis). Insets, Average of detrended responses (i.e., after subtraction of the mean response for all motion strengths, for each neuron). B, D, Aligned to the saccade and including correct trials (and 0% coherence trials sorted by the animal's choices). E, Histograms of the distribution of DI for the neural population recorded by Fanini and Assad (2009) and for the neural population in the RDM-in-RF configuration of the present study. F, Area under ROC for responses to the two directions of motion at 51.2% coherence computed in 40 ms bins. Colored lines at the bottom indicate the time bins in which this metric was significantly >0.5 for the corresponding configuration. G, The relation between the response buildup rate and motion strength. Filled circles represent data from trials with motion in the neuron's preferred direction. Open circles represent the opposite motion direction. Solid and dashed lines indicate corresponding linear regression model fits. Population responses pooled separately for the 2 monkeys are shown in Figure 3-1 and Figure 3-2.
