Figure 6.

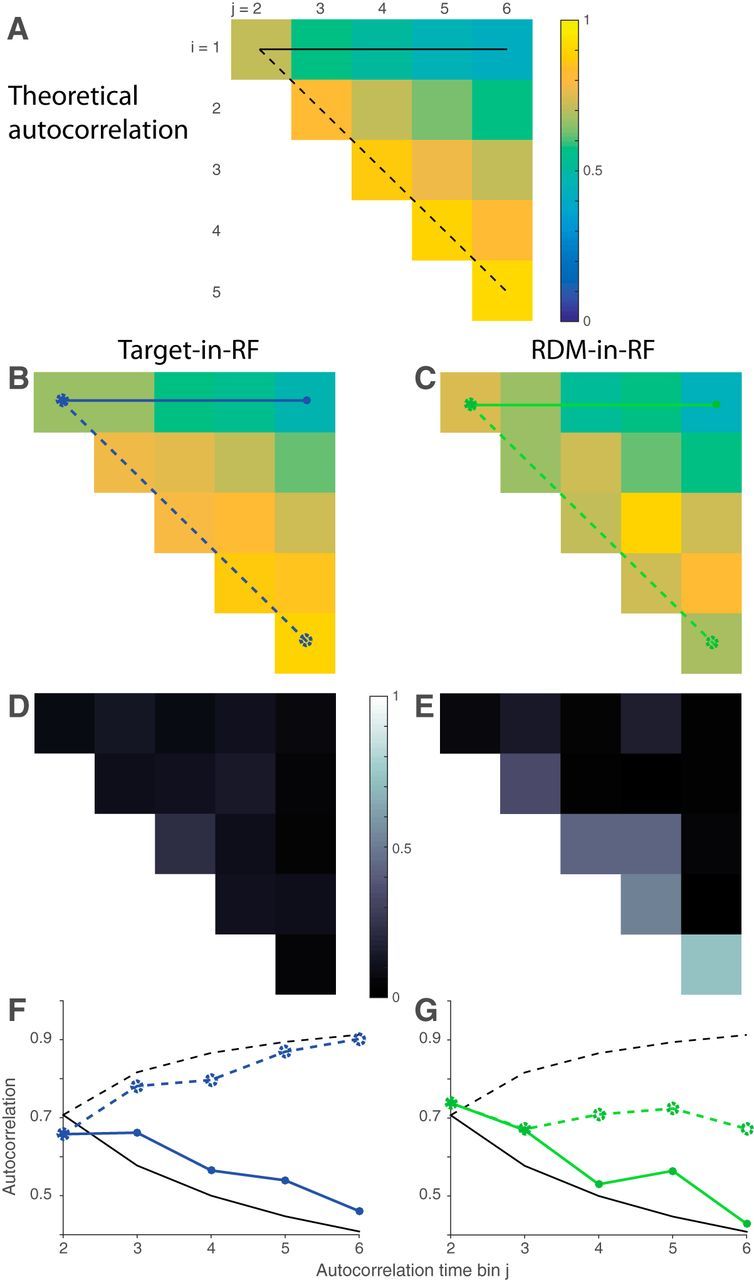
Autocorrelation of responses. A, Theoretical prediction of the autocorrelation matrix for six time bins (ρi,j) of a diffusion process. Only the 15 unique values (upper triangular matrix, i<j) are shown. B, C, Estimated autocorrelation for the neural responses in the two stimulus configurations. D, E, Deviation of B, C from the theoretical predictions shown in A. F, G, Comparison of correlation values in A–C between theory (black lines) and data (colored lines). Solid lines indicate correlation along the top row (between first and jth time bins) and dashed lines indicate correlation along the first juxtadiagonal (between jth and its preceding time bin). Line style and color correspond to those in A–C.
