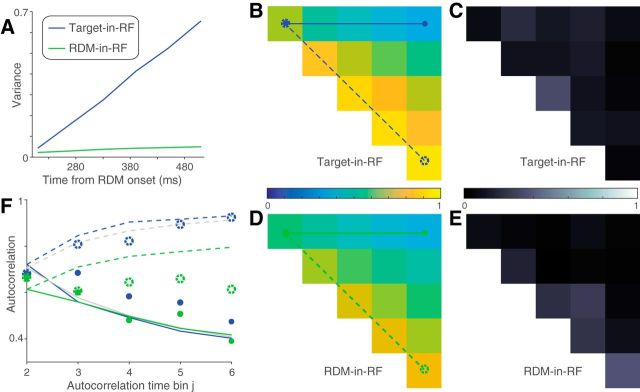
Figure 8.
Variance and correlation of the simulated responses shown in Figure 7. A, Variance as a function of time in two of the simulated suppressed populations (D and T1 for trials with motion supporting T1 choice). B, Autocorrelation in the simulated suppressed Target-in-RF population T1 (conventions as in Figure 6B). C, Deviation of the autocorrelation in the model from the autocorrelation estimated from the data in the Target-in-RF configuration. D, E, Same as B, C for the RDM-in-RF population. F, Comparison of correlation values along the top row (solid lines) and first juxtadiagonal (dashed lines) between the model (B, D) and the data. Circles represent the correlation estimated from data. Filled circles represent the values along the top row. Open circles represent the values along the juxtadiagonal. Gray lines indicate the correlation expected from a diffusion process.

