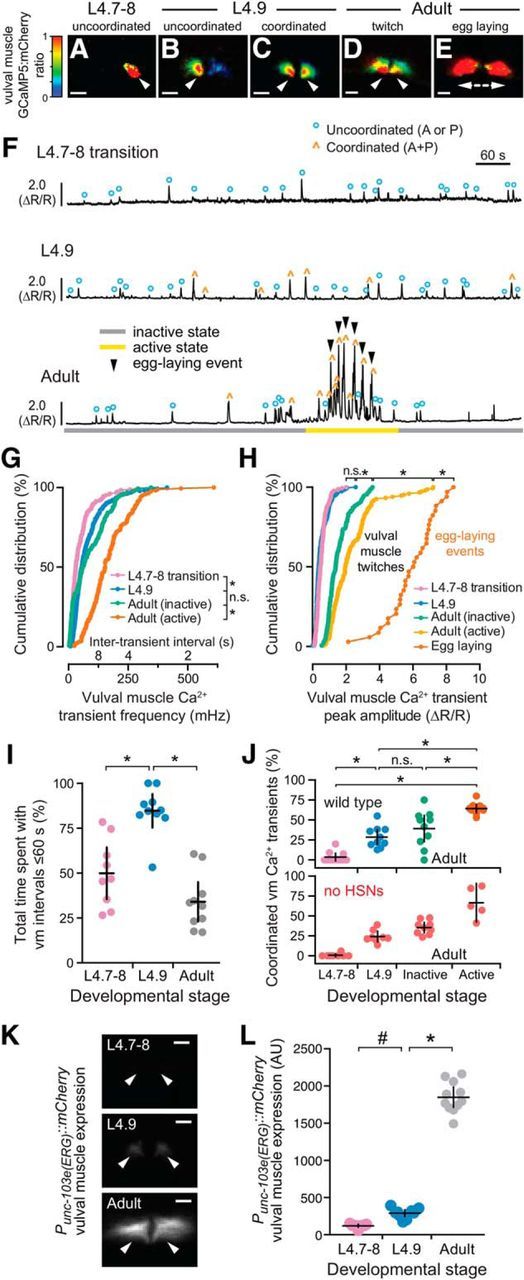
Figure 3.

Development of coordinated vulval muscle Ca2+ transients in the L4.9 stage does not require presynaptic HSN input. A–E, Representative images of the intensity-modulated GCaMP5:mCherry fluorescence ratio during vulval muscle Ca2+ transients at the L4.7–8 (A), L4.9 larval stages (B, C), and during the adult active state (D, E). White arrowheads show localization of Ca2+ transients. Scale bars, 10 μm. Anterior is at left and ventral at bottom. See also Movies 3–6. F, Representative GCaMP5:mCherry (ΔR/R) ratio traces of vulval muscle Ca2+ activity at L4.7–8 (top), L4.9 (middle), and in adult animals (bottom) during an inactive (gray) and active (yellow) egg-laying state. Uncoordinated transients are indicated by blue circles, coordinated transients by orange carets, egg-laying events by black arrowheads. G, H, Cumulative distribution plots of instantaneous vulval muscle Ca2+ transient peak frequencies (G) and amplitudes (H) at L4.7–8 (pink), L4.9 (blue), and in the egg-laying inactive (green) and active state (orange) of adults. *p < 0.0001; n.s. indicates p > 0.9999 (Kruskal–Wallis test). I, Scatterplots show time spent by 9–10 animals with frequent Ca2+ transients (intertransient intervals ≤60 s) at L4.7–8 (pink), L4.9 (blue), and in adults (gray). Error bars indicate 95% confidence interval for the mean. *p ≤ 0.0002, one-way ANOVA. J, Scatterplots showing percentage synchronous anterior and posterior vulval muscle Ca2+ transients in each individual at L4.7–8 (pink), L4.9 (blue), and in adult egg-laying inactive (green) and active states (orange) in wild-type (top) and egl-1(n986dm) animals (red) lacking HSNs (bottom). Error bars indicate 95% confidence intervals for the mean from ≥5 animals. *p ≤ 0.0022; n.s. indicates p ≥ 0.1653, one-way ANOVA. K, Representative images of mCherry fluorescence in the vulval muscles from a unc-103e (ERG) transcriptional reporter in an L4.7–8, L4.9, and adult animal. White arrowheads show anterior (left) and posterior (right) vulval muscle cells. Scale bar, 10 μm. L, Scatterplots showing mCherry fluorescence from the unc-103e promoter in 10 animals. Error bars indicate 95% confidence interval for the mean. #p = 0.0288; *p ≤ 0.0001, one-way ANOVA.
