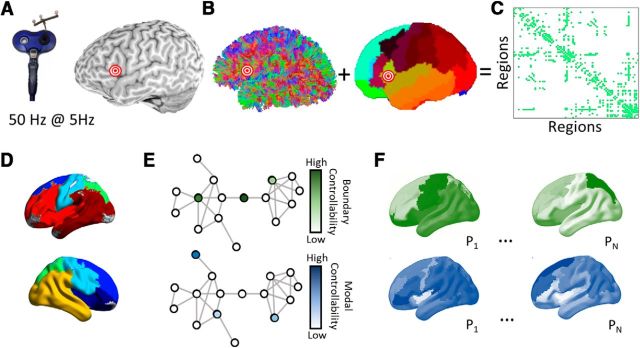
Figure 1.
Overview of methods. A, cTBS was administered to each subject's pars triangularis. B, Diffusion tractography was computed for each subject. A cortical parcellation was registered to each individual's structural T1 image to identify anatomical divisions. C, A region × region structural adjacency matrix was constructed representing the streamline counts between pairs of regions binarized at a threshold retaining the top 10% strongest edge weights within subjects. D, A community detection algorithm was applied to identify an initial consensus partiation on the average network across subjects. E, Modal and boundary controllability were computed for each node (brain region) in the network for each individual. Each node received a rank representing its strength of control in the network heirarchy within the individual. F, Maps representing the variability in modal controllability (top) and boundary controllability (bottom). P1 … N represent different participants. The relationship between controllability values at the LIFG stimulation site and task response times before and after stimulation were examined using mixed-effects models.

