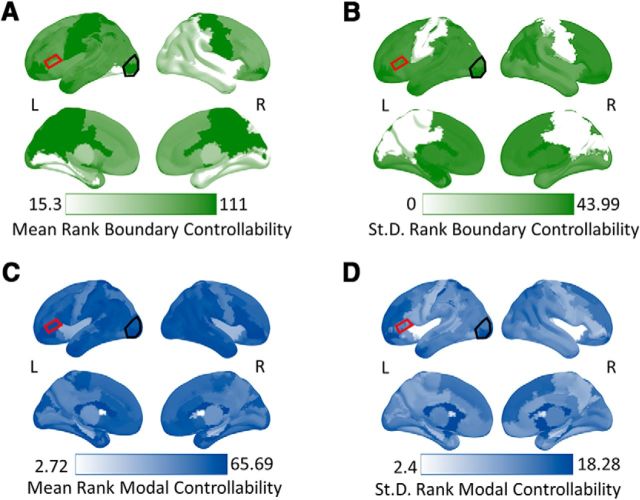
Figure 3.
Mean and SDs of ranked boundary and modal controllability values. Each color map represents either the mean or SD of ranked controllability in brain regions across all subjects in the study. Darker colors represent either higher mean ranks or SD for that region. A, Mean ranked boundary controllability across brain regions. B, SD of ranked boundary controllability values across brain regions. C, Mean ranked modal controllability across brain regions. D, SD of ranked modal controllability values across brain regions. The red outlined region is the LIFG, which is also the site of stimulation. The black outlined region is our lateral occipital site serving as a “bottom-up” control region in our analyses. At the pars triangularis (our LIFG region), boundary controllability had a middle-range value with moderate variability relative to other regions in the brain. Modal controllability in the pars triangularis was high with low variability relative to other regions. The top of each panel represents a lateral view of the brain and the bottom represents a medial view.

