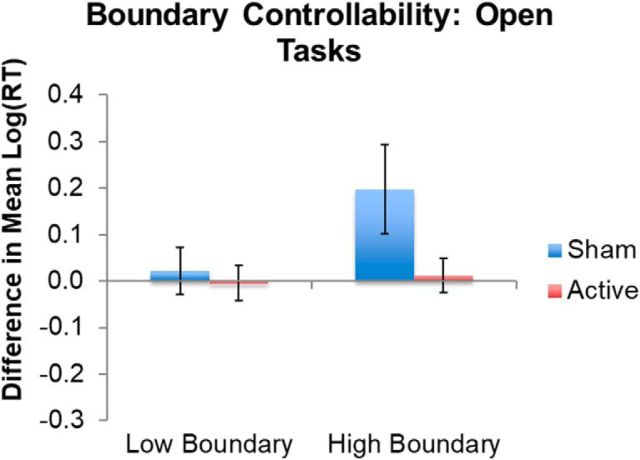
Figure 4.
TMS effects in the significant interaction between TMS and boundary controllability in open language tasks. “High” and “low” represent boundary controllability ranked values above and below the median, respectively, for the sample for illustration. Error bars indicate SE of the differences in mean log-transformed RTs. Lower values on the y-axis represent faster responses in the second session relative to the first session. See Table 1 for full model results. Note that, for transparency, the mean and SE of the log-transformed RTs do not represent model-adjusted values.

