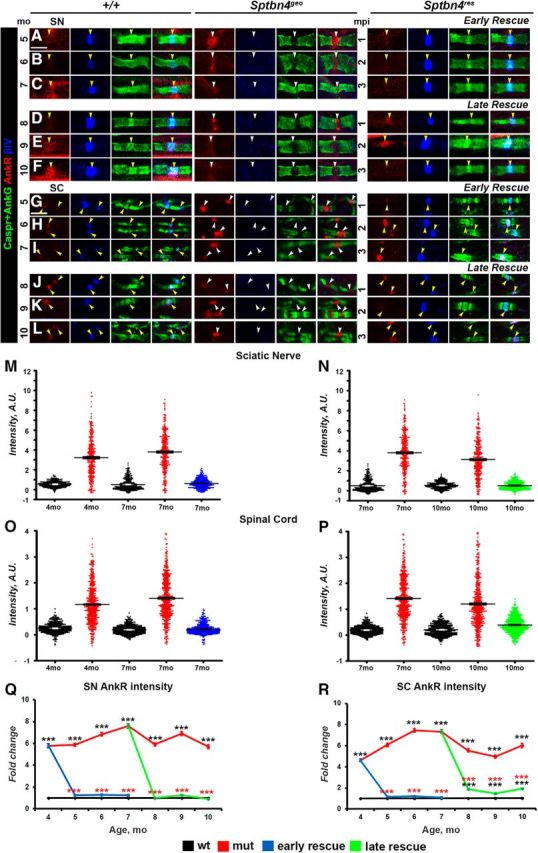
Figure 5.

Newly expressed βIV spectrin causes decrease in AnkR levels at the nodes. A–L, Immunostaining of SNs (A–F) and SCs (G–L) from 4–10-month-old age-matched control (+/+), Sptbn4geo mutant, and Sptbn4res mice with antibodies against AnkR (red), βIV spectrin (blue), and Caspr (green). Yellow and white arrows indicate βIV spectrin-negative and βIV spectrin-positive nodes, respectively. Scale bar, 4 μm. M–P, Distribution of the nodal population by their nodal AnkR fluorescence intensities in SNs (M, N) and SCs (O, P) at the initial prerescue stage and at the latest rescue time point (n = 300 nodes from 3 mice per genotype in SNs; n = 600 nodes from 3 mice per genotype in SCs). Fluorescence intensity: arbitrary units (A.U.) × 100. Q, R, Quantification of average AnkR fluorescence intensity in the SN (Q) and SC (R) nodal area standardized to the same age control values from 4–10-month-old age-matched control (+/+), Sptbn4geo mutant, and Sptbn4res mice (n = 300, with ≥100 nodes from each animal's SNs; n = 600, with ≥200 nodes from each animal's SCs. All data are represented as mean ± SEM; *p < 0.05; **p < 0.01; ***p < 0.001; 2-way ANOVA with Bonferroni's post hoc analysis).
