
Figure 7.
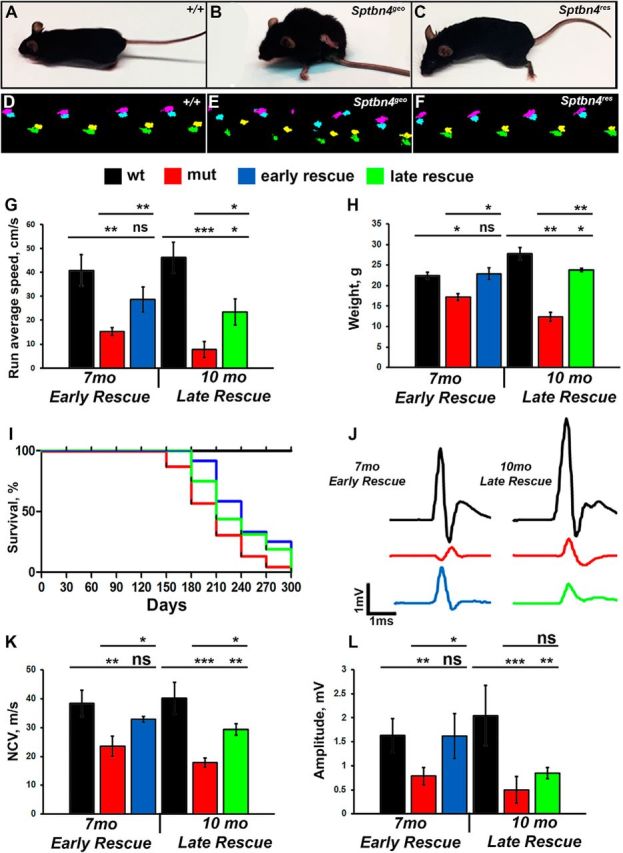
Motor function and nerve conduction restoration after βIV spectrin re-expression. A–C, Photographs of 10-month-old control (+/+), Sptbn4geo mutant, and Sptbn4res mice at 3 mpi. D–F, Representative Catwalk footprints of 10-month-old control (+/+), Sptbn4geo mutant, and Sptbn4res mice at 3 mpi. G, Quantifications of the average running speed from Catwalk gait recordings of early-rescue and late-rescue mice (n = 7–10 mice/genotype). H, Body-mass change in control (+/+), Sptbn4geo mutant, and Sptbn4res mice at early-rescue and late-rescue stages. Equal numbers of males and females were included in each control (+/+), Sptbn4geo mutant, and Sptbn4res early-rescue and late-rescue groups (n = 7–10 mice/genotype). I, Survival curve for control (+/+), Sptbn4geo mutant, and Sptbn4res early-rescue and late-rescue groups. J, Representative electrophysiological profiles of CAPs from 7-month-old and 10-month-old SNs of control (+/+), Sptbn4geo mutant, and Sptbn4res early-rescue and late-rescue groups. K, L, Quantification of the NCV (K) and amplitude (L) in control (+/+), Sptbn4geo mutant, and Sptbn4res early-rescue and late-rescue groups (n = 7–10 mice/genotype). All data are represented as mean ± SEM. *p < 0.05; **p < 0.01; ***p < 0.001, two-way ANOVA, Bonferroni's post hoc analysis.