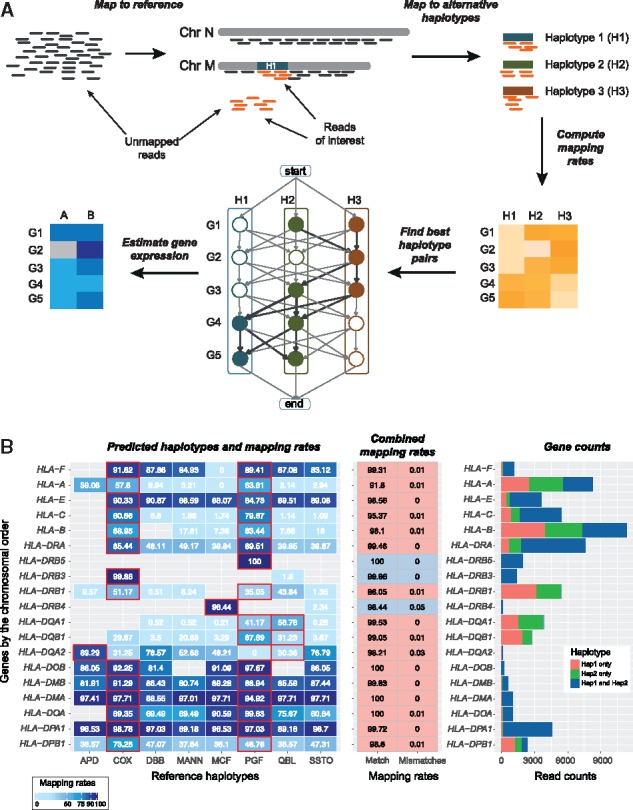
Fig. 1.

Overview of AltHapAlignR workflow and sample output with haplotype prediction. (A) Schematic depicting pipeline. Preprocessing includes mapping of reads to the reference haplotype with unmapped reads extracted and realigned to the alternative haplotypes independently. Using the scoring weights of the haplotype pairs (based on editing distances of aligned reads to the respective references), closest haplotypes are selected for each gene while maximizing the quality of read alignments and minimizing the number of switches between haplotypes. Gene and haplotype level expression is estimated based on reads aligned to the selected haplotypes. (B) Example of AltHapAlignR output using synthetic heterozygote data (PGF and COX 1:1 ratio). Haplotype prediction and mapping rates (left panel). Illustrated for each classical HLA gene (y-axis) and eight known haplotypes. Numbers in each cell are mapping rates in each haplotype. Predicted haplotypes highlighted with red border. Empty cells represent genes not annotated in given haplotype. Combined mapping rates from the predicted haplotypes (middle panel). Mapping rate (first column): read counts of gene in the predicted haplotype(s)/total read count of the gene across all haplotypes. Mismatch mapping rates of predicted haplotypes (second column). Pink (predicted heterozygote), grey (homozygotes). Gene counts (right panel). Raw read counts for each HLA gene
